
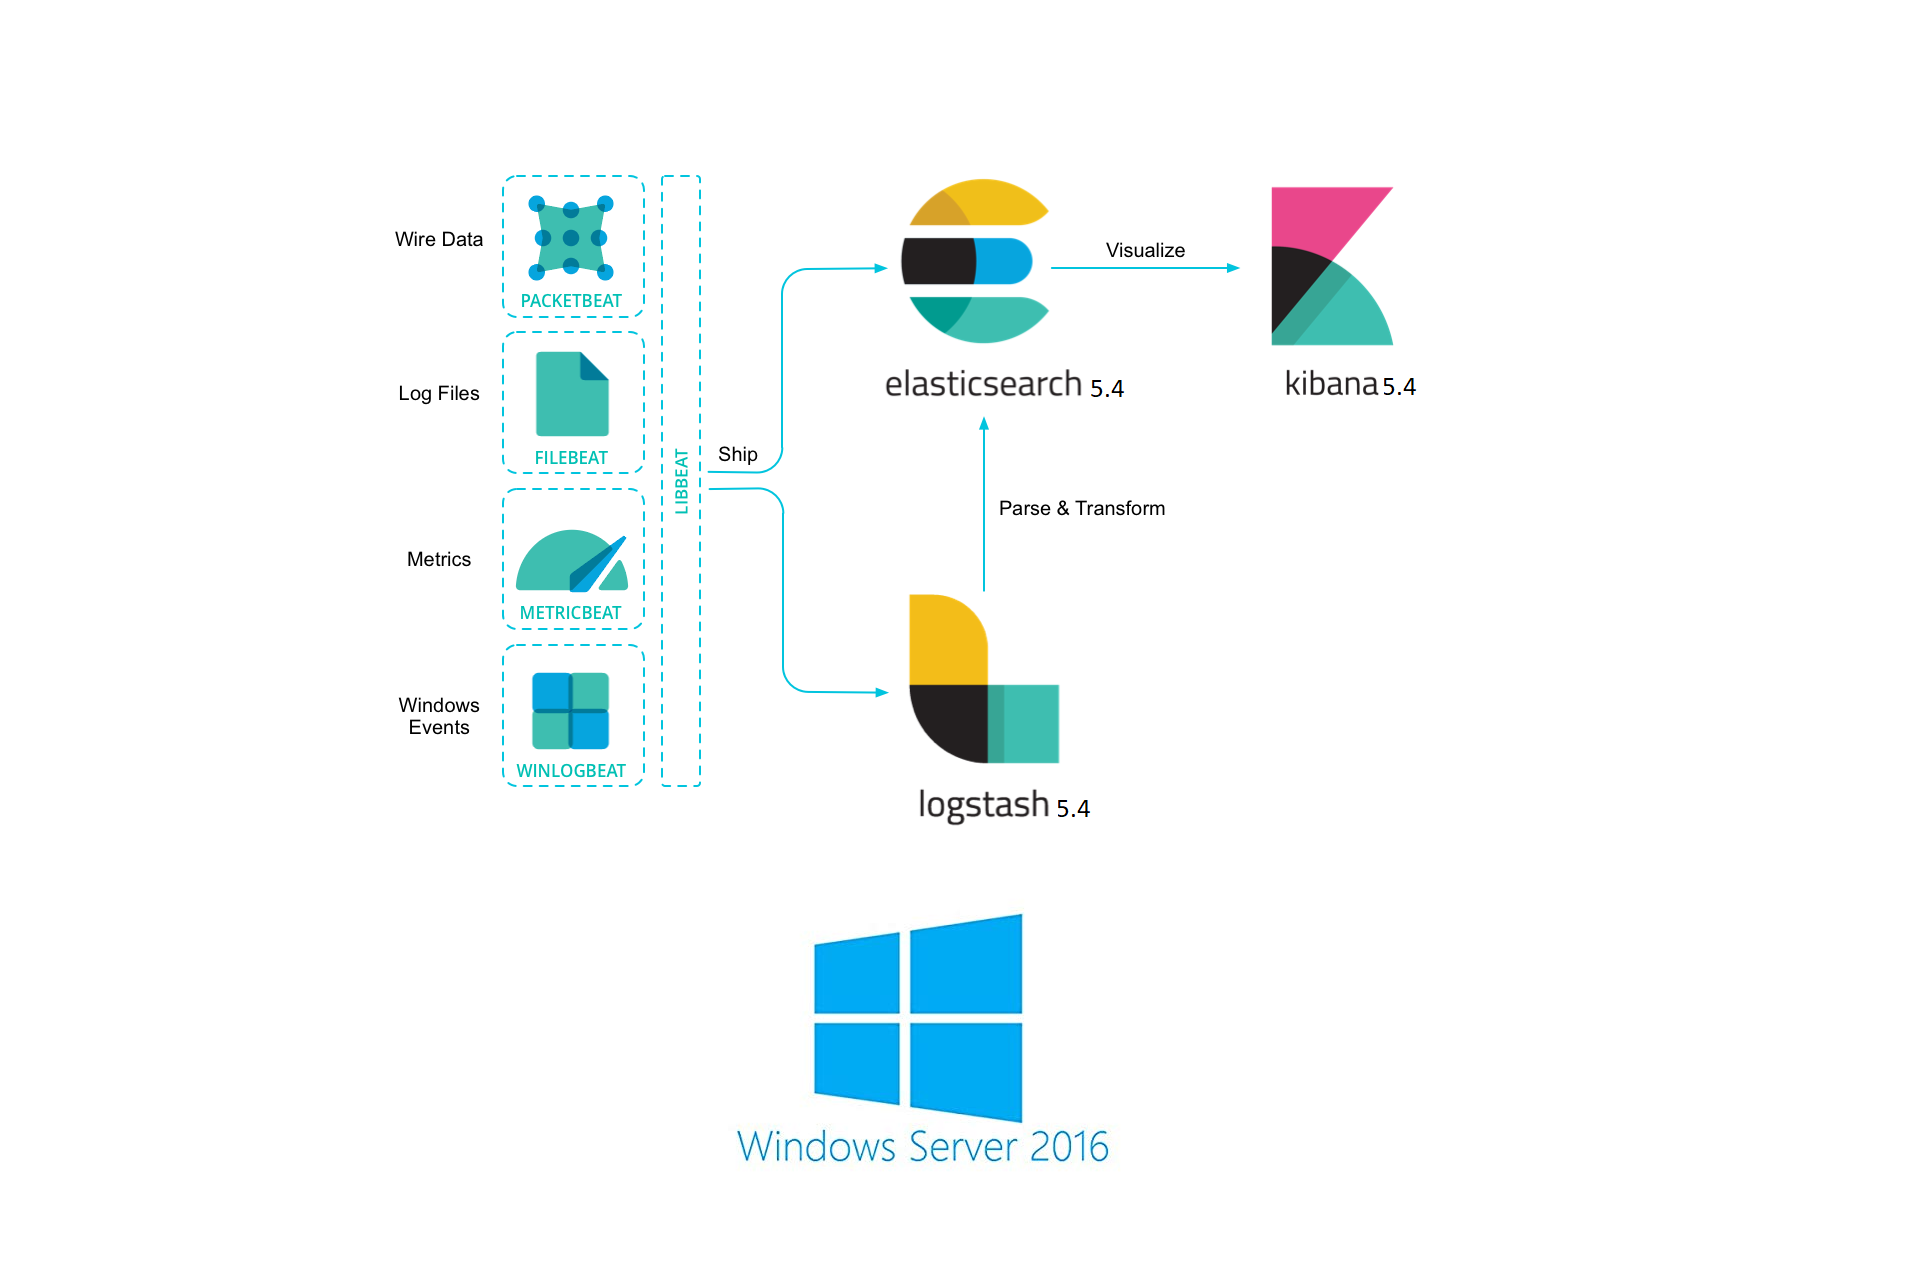
This guide should give you a good example of how to setup Logstash on a Windows environment for anyone that is not interested in using Linux.
This guide was created by having all the applications on the same server, if you have different servers you have to think of the firewalls and you must alter the guide accordingly to fit your situation.
This guide was tested on:
Windows Server 2016
In this guide I will show that it is also possible to run Logstash on a Windows machine and use IIS as web server.
So lets start!
Download all requirements:
Elasticsearch: https://artifacts.elastic.co/downloads/elasticsearch/elasticsearch-5.4.0.zip
Logstash: https://artifacts.elastic.co/downloads/logstash/logstash-5.4.0.zip
Kibana: https://artifacts.elastic.co/downloads/kibana/kibana-5.4.0-windows-x86.zip
Shippers:
Filebeat: https://artifacts.elastic.co/downloads/beats/filebeat/filebeat-5.4.0-windows-x86_64.zip
Packetbeat: https://artifacts.elastic.co/downloads/beats/packetbeat/packetbeat-5.4.0-windows-x86_64.zip
Winlogbeat: https://artifacts.elastic.co/downloads/beats/winlogbeat/winlogbeat-5.4.0-windows-x86_64.zip
Metricsbeat: https://artifacts.elastic.co/downloads/beats/metricbeat/metricbeat-5.4.0-windows-x86_64.zip
Heartbeat: https://artifacts.elastic.co/downloads/beats/heartbeat/heartbeat-5.4.0-windows-x86_64.zip
In short explained:
Filebeat is for shipping log files to Logstash.
Packetbeat is for analyzing your network data.
Winlogbeat is for shipping windows event logs.
Metricbeat is for shiping and analyze metrics.
Heartbeat is for uptime monitoring.
Service manager:
NSSM: https://nssm.cc/ci/nssm-2.24-101-g897c7ad.zip
NSSM is required to make it so “Logstash” and “Kibana” can run as windows services.
Feel free to download the newest versions, however be aware that Logstash is a continuous developed program and things might not work the same as I show below in the new version.
You do not have to install all shippers you can simply use the one that will benefit you and skip the parts of the other shippers.
Now just simply exact all the zip files to a folder that I created myself called “ulyaoth” in “c:\ulyaoth\” just o make things more easy.
So for me it looks like this now:
c:\ulyaoth\elasticsearch-5.4.0

c:\ulyaoth\filebeat-5.4.0

c:\ulyaoth\heartbeat-5.4.0

c:\ulyaoth\kibana-5.4.0

c:\ulyaoth\logstash-5.4.0

c:\ulyaoth\metricbeat-5.4.0

c:\ulyaoth\nssm-2.24-101

c:\ulyaoth\packetbeat-5.4.0

c:\ulyaoth\winlogbeat-5.4.0
Please be aware this is the directory structure I use, if you change the naming of the directories or files you have to update everything correct in the guide to fit your situation.
Prepare the server:
Download the JDK version of Java and install it.
Go to the java website: https://www.oracle.com/technetwork/java/javase/downloads/jdk8-downloads-2133151.html
(Since Oracle updates Java frequently please download the latest and ignore if my version is slightly older in the images that follow)
Accept the license and then download: “Windows x64 (jdk-8u131-windows-x64.exe)” package.
Now install it by double clicking the file.
You should now see:
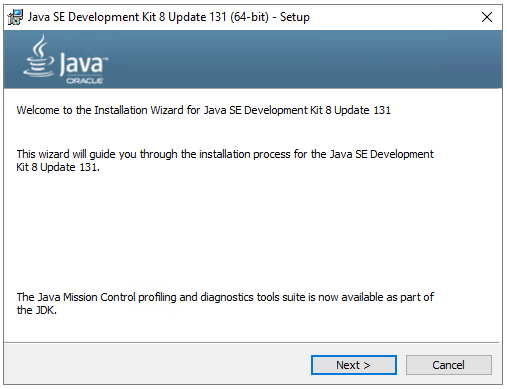
On this window press “Next” to see the get to the next window.
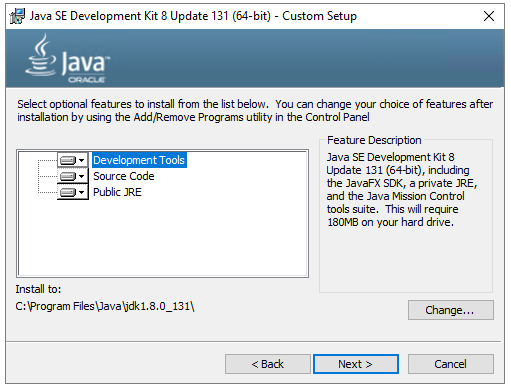
On this windows press again on the “Next” button to come to the next window.
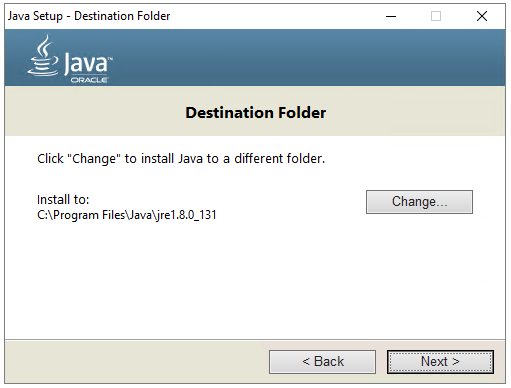
Here you have you can select the destination folder where Java will be installed for me the default location is fine if for you also press “Next” to go to the next window or press “Change” to update the location and then press “Next”.
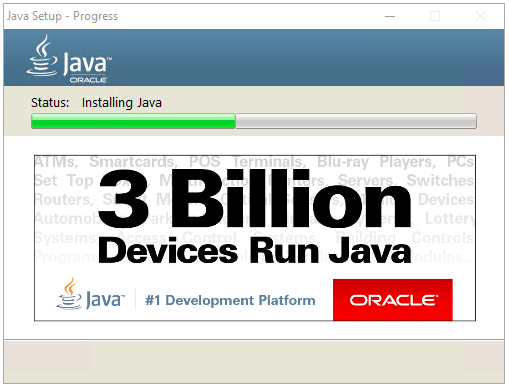
This window means it is installing Java so wait till it completes and you will see a new window.
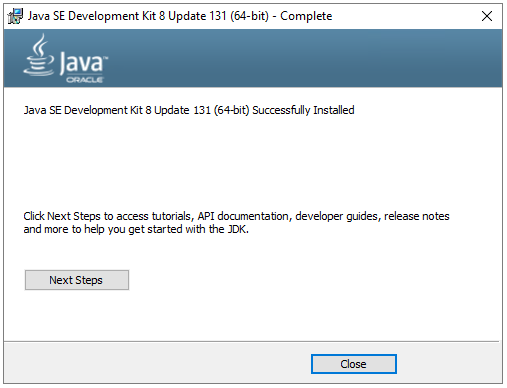
Java is now installed so press the “Close” button.
Now let’s add the JAVA_HOME variable to the server by simply right clicking on “This PC” and choose “Properties” then follow the below steps.
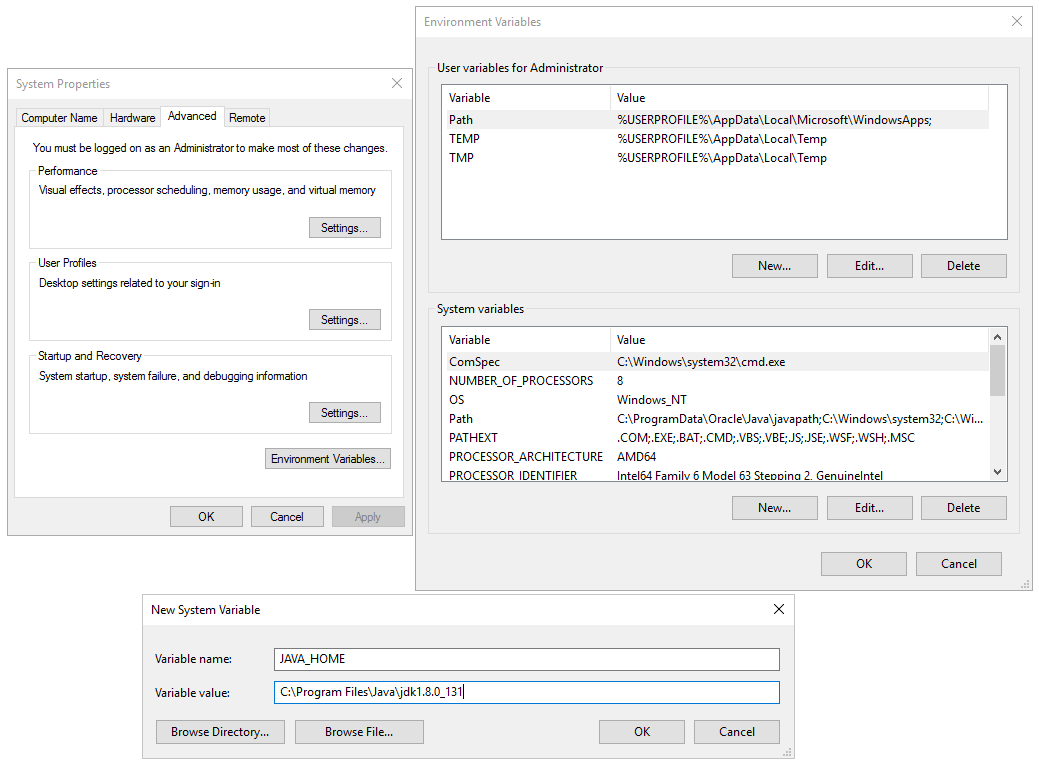
Now fill in the new window that appears like I did in the above picture and press on “ok” and “ok” on the other window.
Variable Name: JAVA_HOME
Variable value: C:\Program Files\Java\jdk1.8.0_131
That is all you should have to do.
Prepare IIS:
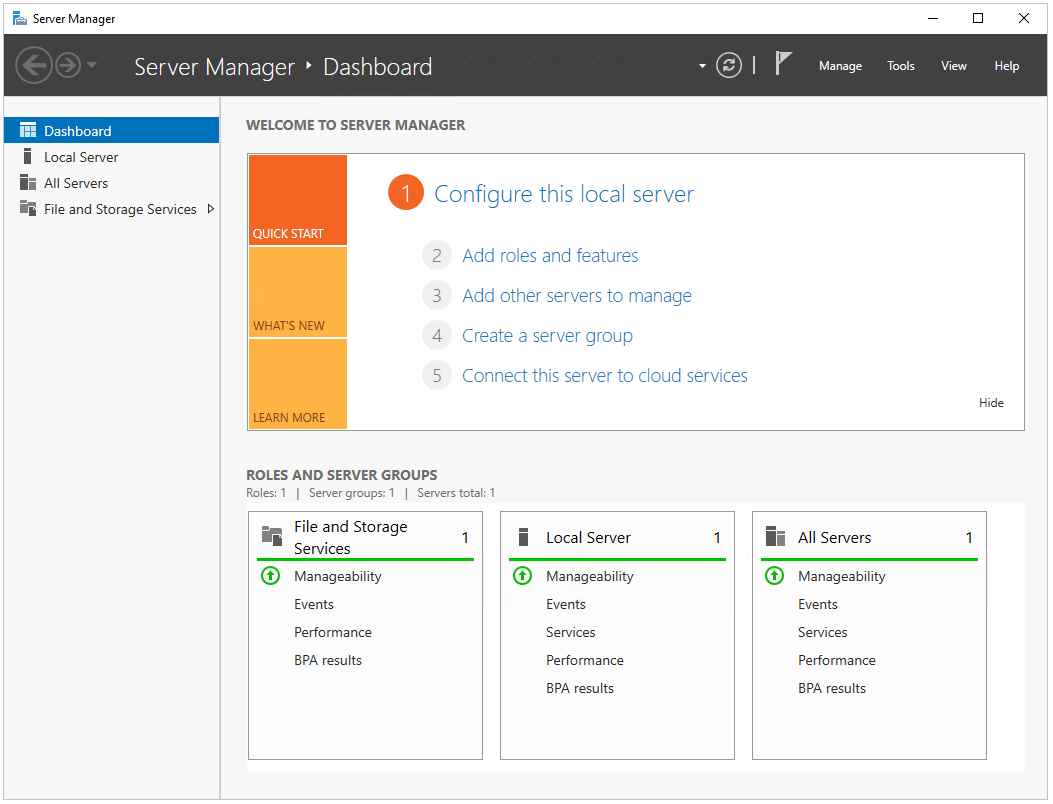
Open Server Manager:
Click on “2 Add roles and features” and a new window should appear:
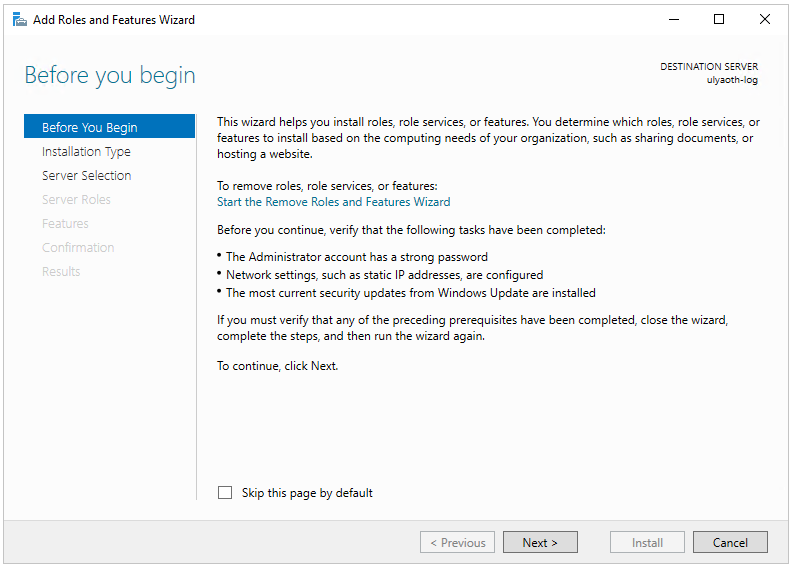
On this page press on “Next” to go to the next window.
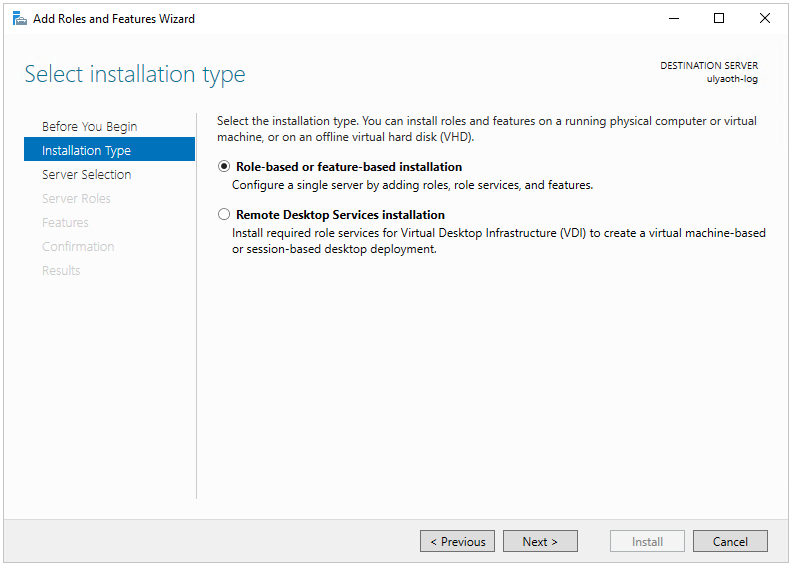
On this page leave the default selection “Role-based or feature-based installation and press “Next” again.
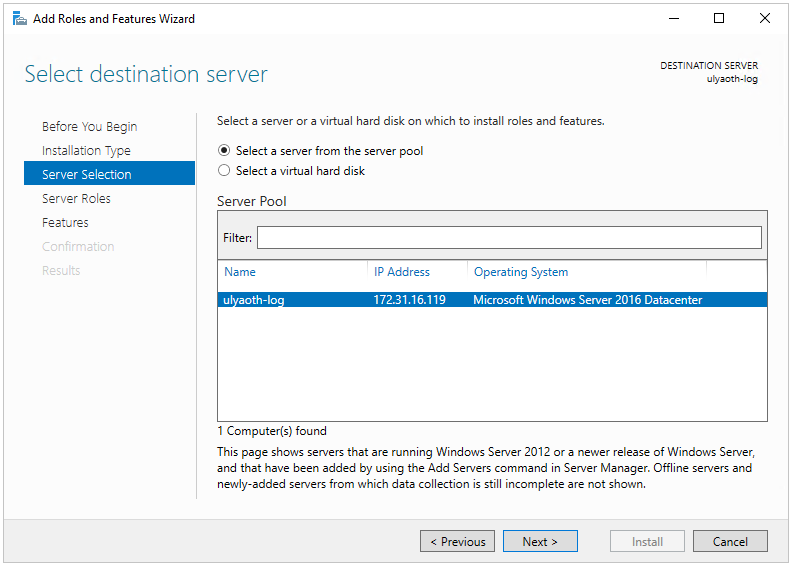
For me all settings are fine here if that is the case for you also then press on “Next” again to go to the next window.
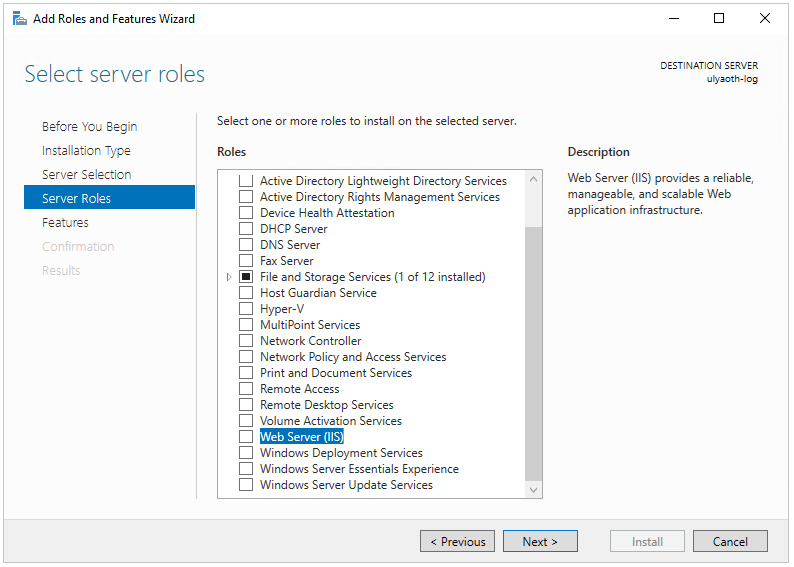
On this window scroll down till you see “Web Server (IIS) the one I put a small red box around and then click the select box and then a new window should popup like this:
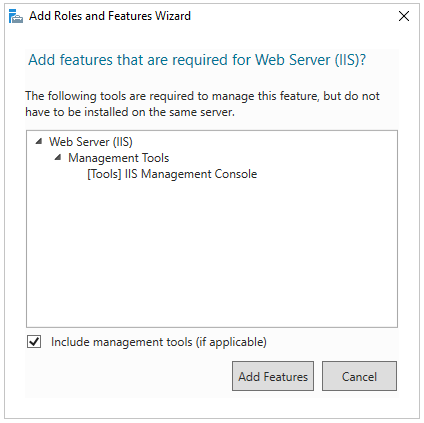
Simply press the “Add Features” button and you come back at the previous image where you can now press “Next”.
Here you can choose to install additional features however we do not require it for this guide so simply press “Next”.
On this informative page press “Next” again.
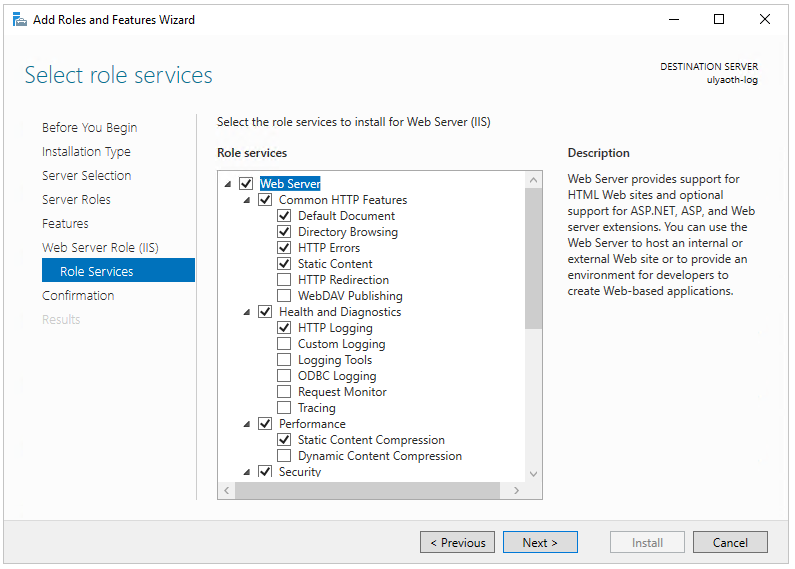
On this page you can select options for your IIS webserver you can go trough them and select what you like, normally I at-least select “HTTP Redirection” as it is a useful option, you can select it by clicking the selection box.
if you need nothing else press “Next” again.
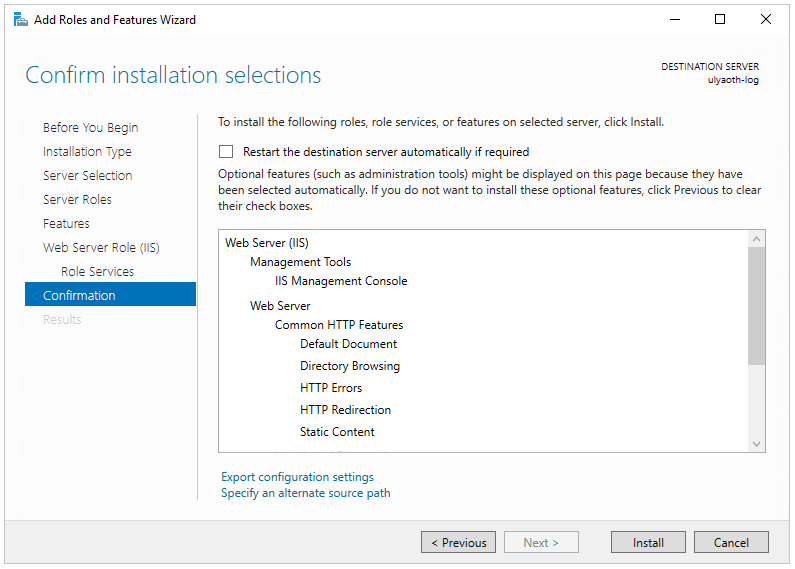
This confirmation window shows everything that will be installed so double check it so you do not install things you do not wish and then press the “Install” button to start the installation and you will see the following window:
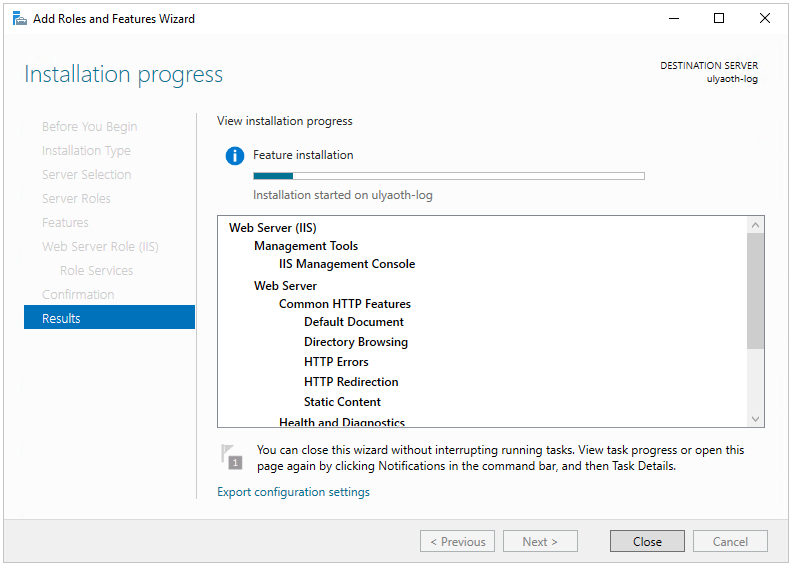
Just let it go and when the bar is fully blue and says it is finished press the “Close” button.
IIS is now fully installed and ready to be used.
Windows 10:
On Windows 10 you should go to your “Control Panel” then go to “Program and Features” and then click on “Turn Windows features on or off” here you will find “Internet Information Service” which is IIS.
Now we also have to install Microsoft Web Platform Installer 5.0 so go to the following website and download it: http://www.microsoft.com/web/downloads/platform.aspx
Once you have downloaded the file called “wpilauncher.exe” simply click it and after a while the app opens and in the right top corner you have a search box.
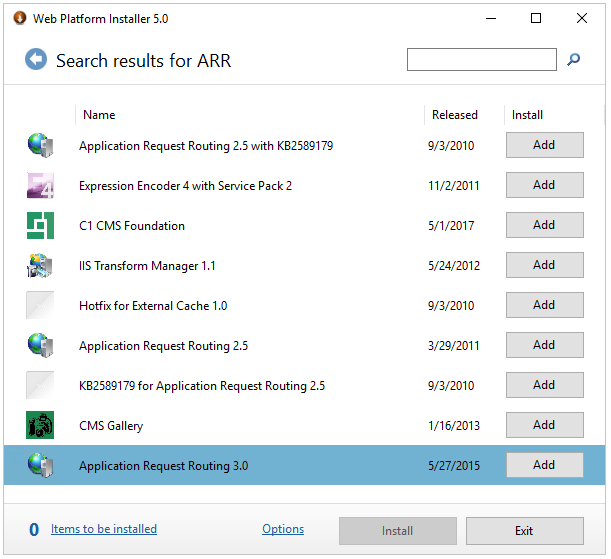
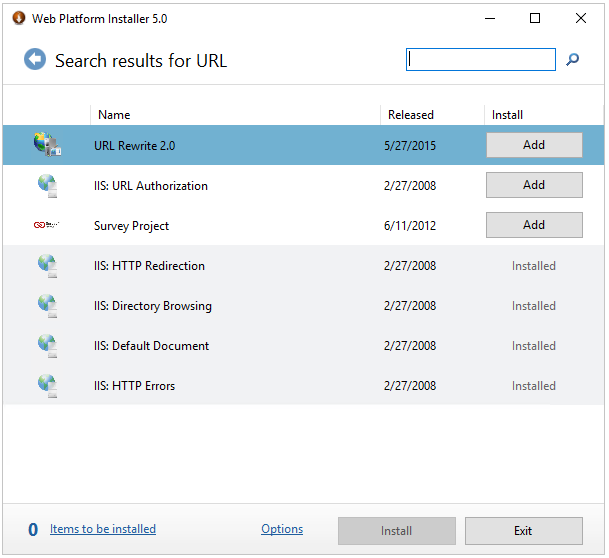
In the search box type ARR and press the enter key, you will see a list of applications that matches your search. The one we are interested in is “Application Request Routing 3.0” so find it in the list and press the “Add” button behind it:
Then use the search box again in the top but this time search for “URL Rewrite” you will see then the application “URL Rewrite 2.0” now press again the “Add” button behind it:
Now you have added the two additional applications we need you can go ahead and press the “Install” button and the following popup will appear:
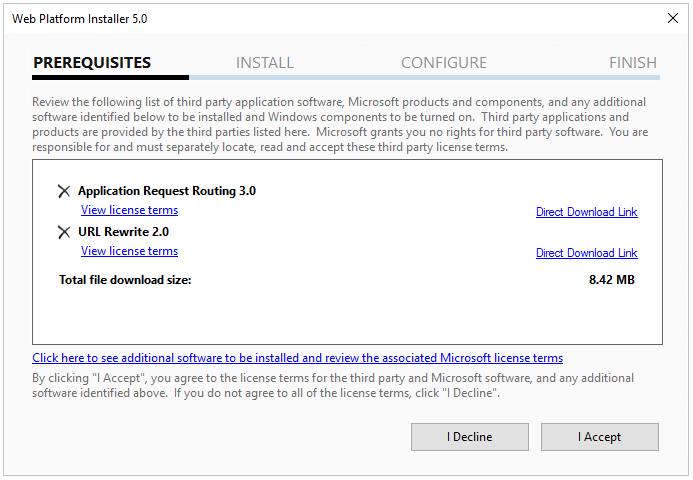
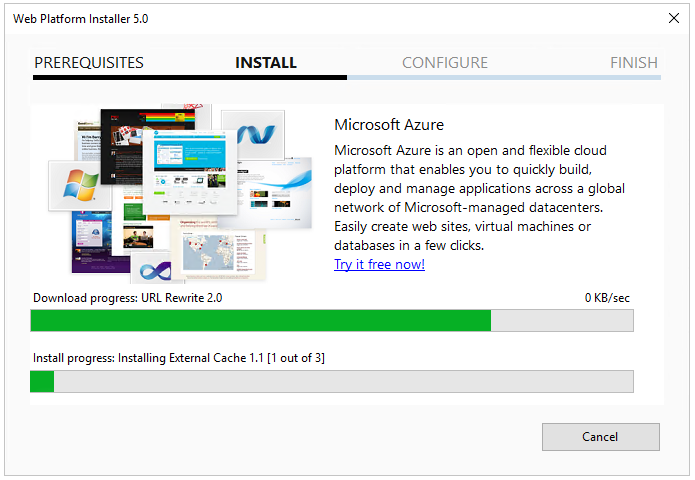
If everything looks fine as you selected press the “I Accept” button to start the installation it should look like this by now:
Once this window is finished it should show a new window confirming that everything is installed:
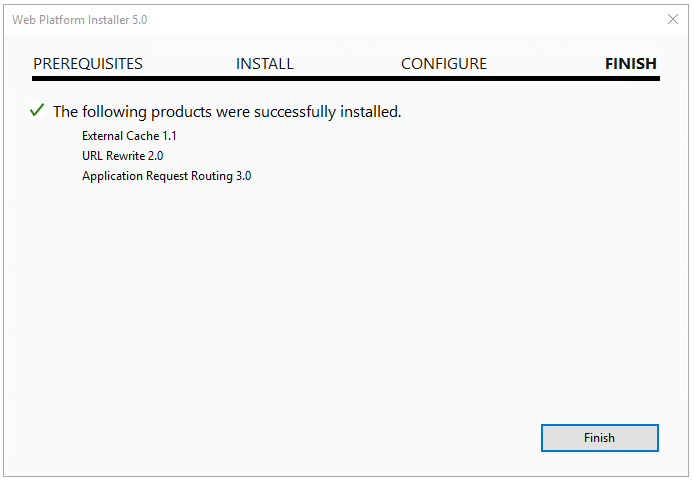
Just press on “Finish” to complete the installation and then on “Exit” to close the whole app.
Now open IIS Manager and you should see a window as below.
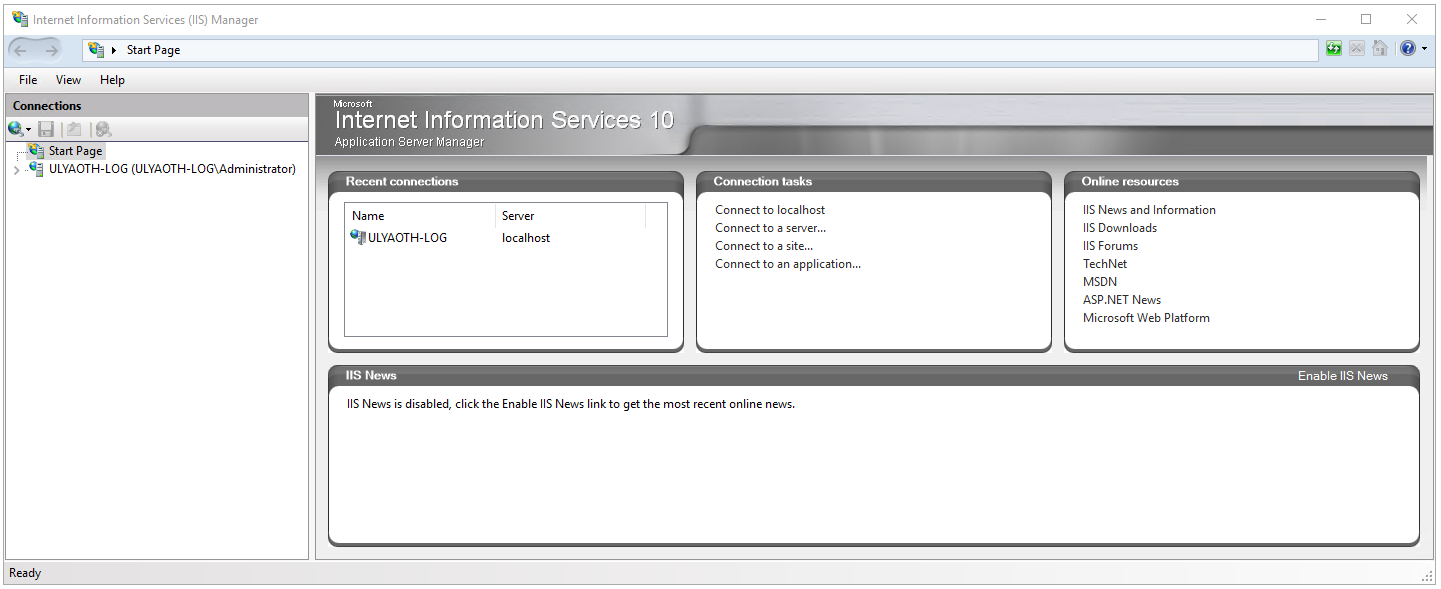
Version could be different depending on the Windows version you are using.
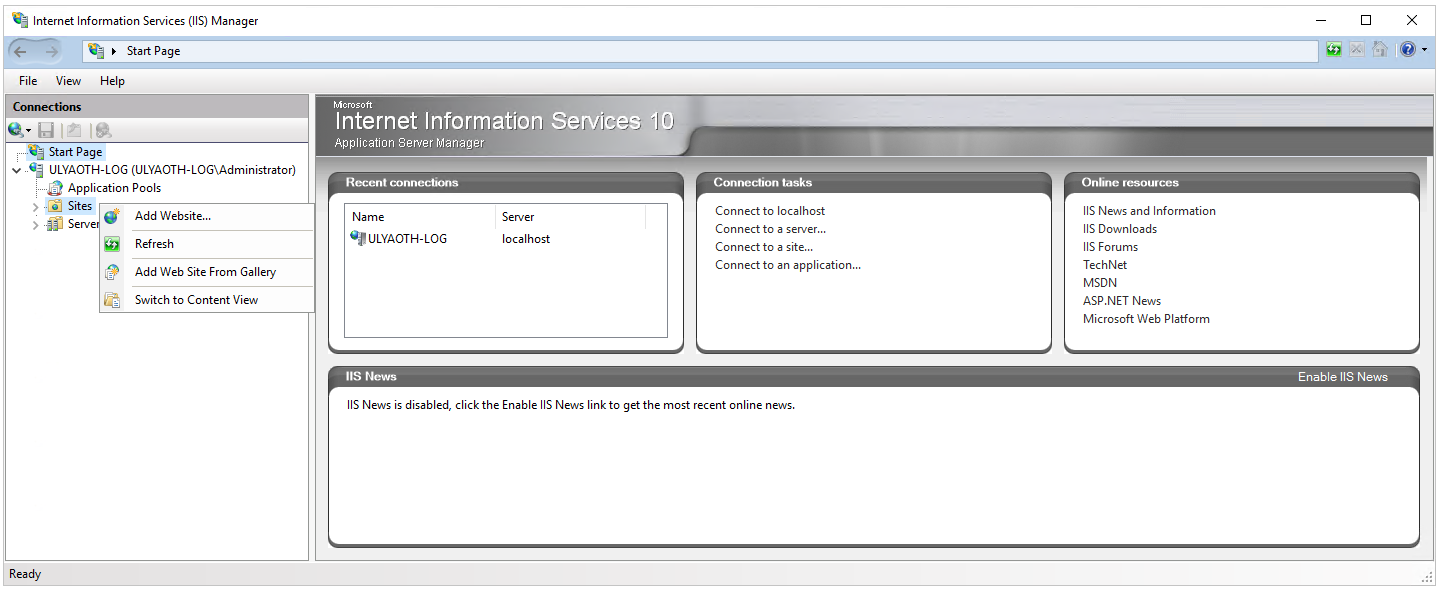
From this window we will create a new website for Kibana in IIS.
In the left window open up by clicking on your host name, for me this is “ULYAOTH-LOG” then right click on “sites” that just showed up and click “Add Website” as you see on the image below:
Once you click it you should get a popup window like the image below.
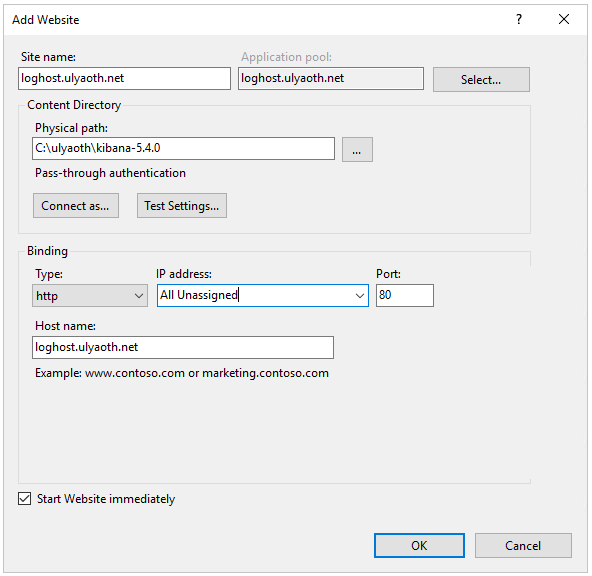
You should fill it in as I did above with of-course “your” information, if you wish to have SSL then change the “Type” field to “https” and select your SSL certificate at the option that will show.
it is important to know the site and host name this is something you have to alter to your own naming, if you want to use my name you have to update you hosts file:
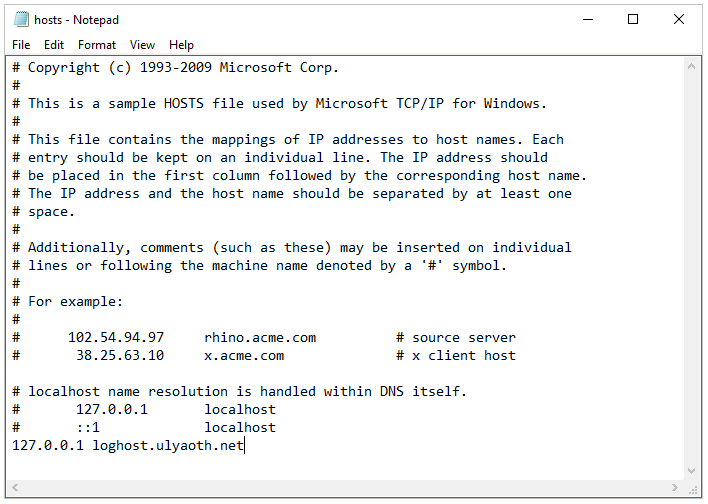
Open a powershell and type the following commands:
1. cd C:\Windows\System32\drivers\etc
2. notepad hosts
It should open notepad and in the bottom just add this:
127.0.0.1 loghost.ulyaoth.net
It should look like this:
And as final part we have to setup a reverse proxy in IIS to Kibana.
Click on your newly created name in the left window mine is called “loghost.ulyaoth.net” and then in the left window allot of icons will appear:
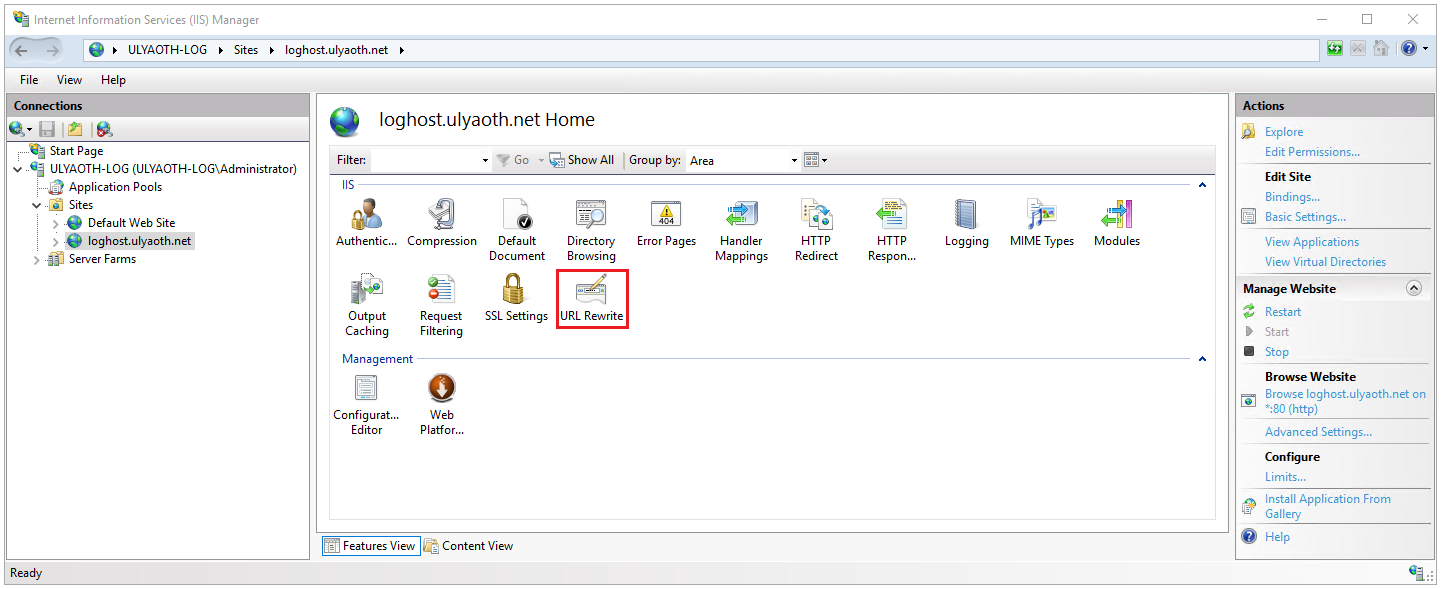
On the image above double click on the “URL Rewrite” button the on I added a red box around and then you should see the following window:
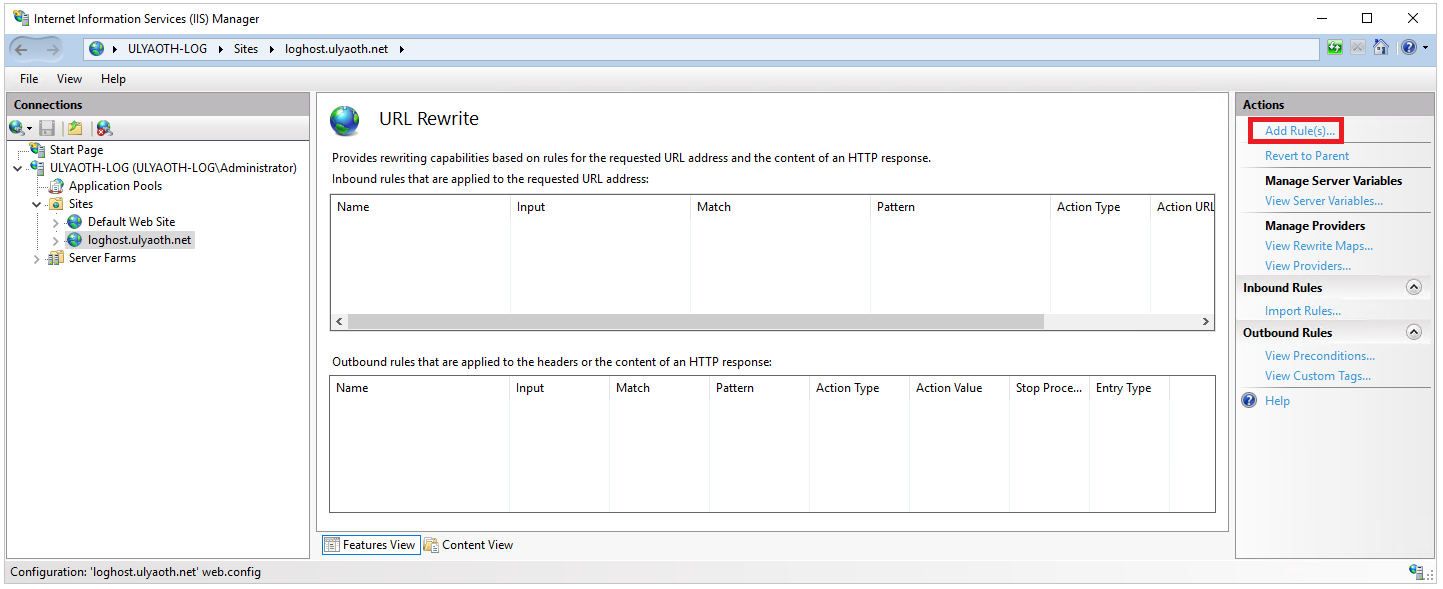
On the above image you this time click in the right menu on “Add Rules(s)…” the one I again added a red box around and you should see the following popup window:
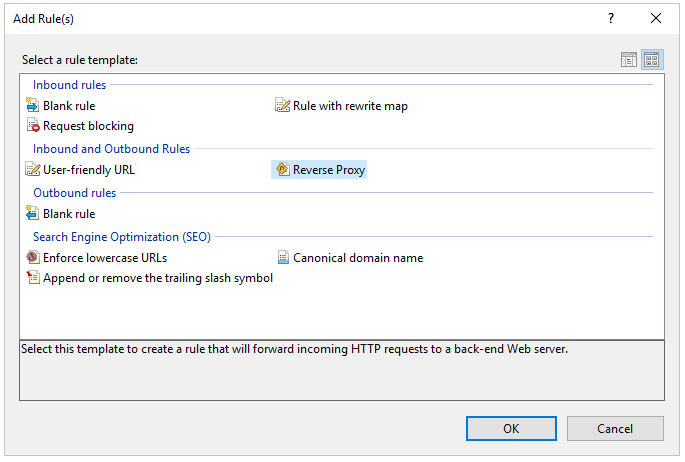
On this screen click on “Reverse Proxy” and then in the bottom on the “OK” button:
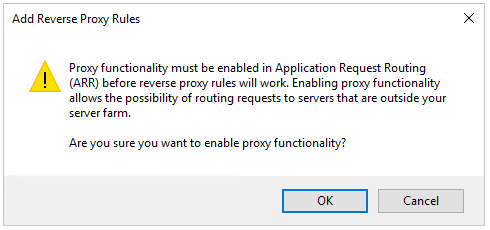
Read the warning to understand the impact of doing a reverse proxy and then press the “OK” button since we require this functionality.
You now will see a windows where you fill in the reverse proxy information:
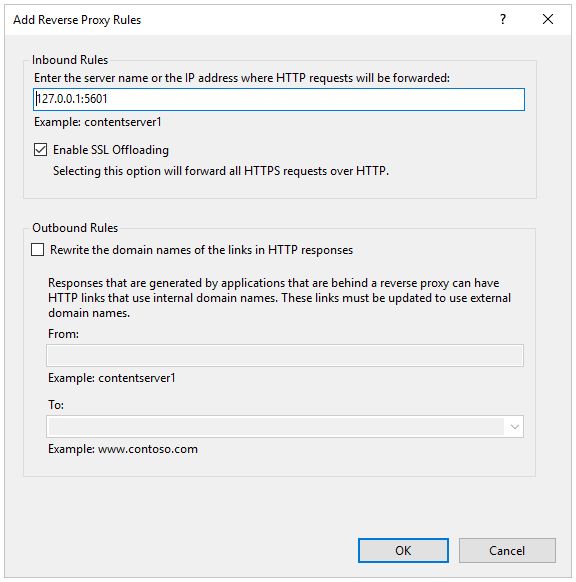
On this windows make sure you fill everything in exactly as I did above:
Inbound Rules: 127.0.0.1:5601
If you did this you should have everything as I did so go ahead and press on the “OK” button.
To explain it in short the ip you entered “127.0.0.1” and port “5601” this is where Kibana will run on your server, since in my personal opinion it is not recommended to run Kibana directly towards the internet for security reasons and or you might need additional futures you let IIS be the link in-between since this is a well tested web-server.
You have come to the point where you have prepared the server by installing Java, IIS and created the reverse proxy for Kibana.
In the next part we will configure and start the Elastic Stack.
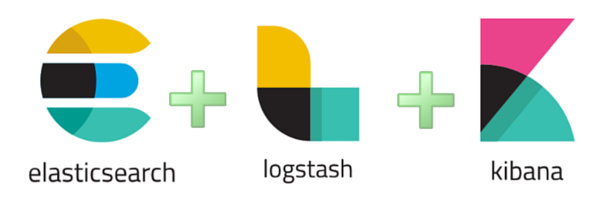
Configure and start Elastic Stack:
1. Elasticsearch:
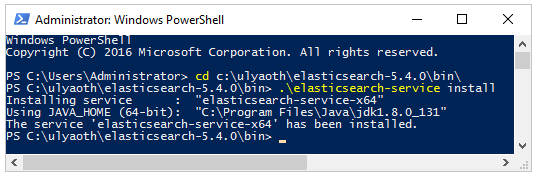
Open powershell and type the following commands:
cd c:\ulyaoth\elasticsearch-5.4.0\bin\

.\elasticsearch-service install
It should look like this in your powershell.
Now continue by typing the following:
.\elasticsearch-service manager
You should see the Elasticsearch service manager:
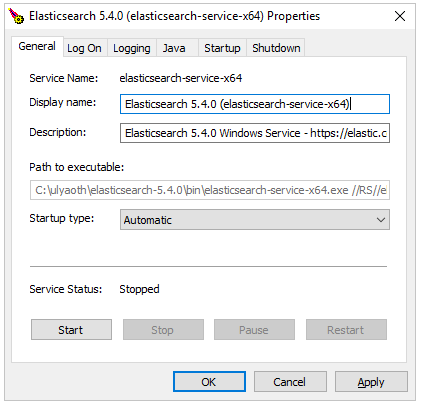
You have to change on the tab the “Startup type” from Manual to Automatic and then press Apply this should make Elasticsearch start automatically on server boot.
This window contains some more options such as how much memory Elasticsearch will use you can find this on the “Java” tab I would suggest to make this fitting for your server if you have a servers that will handle a huge amount of logs I would increase the “Maximum Memory Pool: 1024” at least to a higher amount.
Before you close the window make sure to press “Start” so it actually will run right now 🙂
This is everything to start ElasticSearch automatically on boot to test that it is working open a browser and go to the url “127.0.0.1:9200”.
If you see a json string something like what you see below in the picture then it means your ElasticSearch is running:
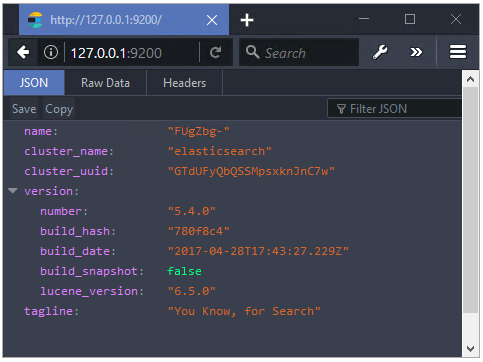
(I user Firefox Developers edition that is why it looks black, yours probably shows as a white site).
2. Logstash:
Download the required configuration file for Logstash from our github.
Do this by opening powershell and then run the following command:
Start-BitsTransfer -Source https://raw.githubusercontent.com/ulyaoth/tutorials/master/configs/windows/logstash/logstash.conf -Destination C:\ulyaoth\logstash-5.4.0\bin\
Your powershell should look like this:
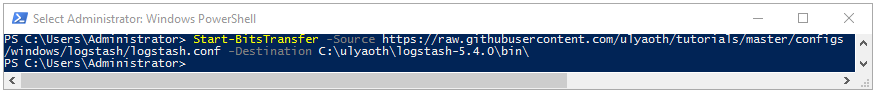
This should place the file called “logstash,json” in the directory “C:\ulyaoth\logstash-5.4.0\bin\”.
make sure to open the actual config and see if you need to change anything that will fit your situation or naming.
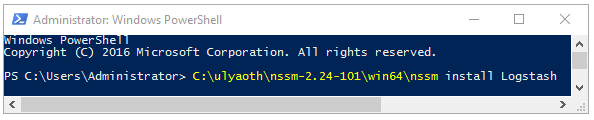
We will now use the downloaded NSSM from the start of the guide to create a service for Logstash.
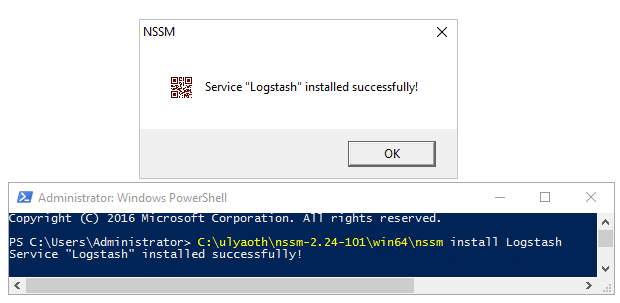
Now open powershell and type the following command:
C:\ulyaoth\nssm-2.24-101\win64\nssm install Logstash
Like this:
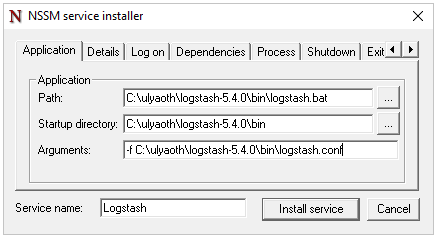
You will now see a GUI to create a service on the first tab “Application” fill in the following:
Path: C:\ulyaoth\logstash-5.4.0\bin\logstash.bat
Startup directory: C:\ulyaoth\logstash-5.4.0\bin
Arguments: -f C:\ulyaoth\logstash-5.4.0\bin\logstash.conf
It should look like this:
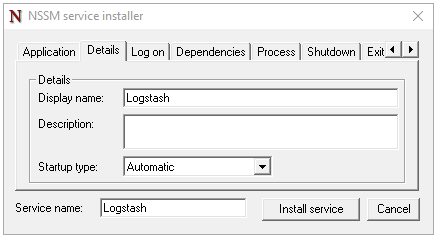
If everything looks the same then go to the “Details” tab make sure it looks the same as below:
Now the following step is additional but recommended if you are 100% going to use Elasticsearch, click on the “Dependencies” tab and add the following: elasticsearch-service-x64
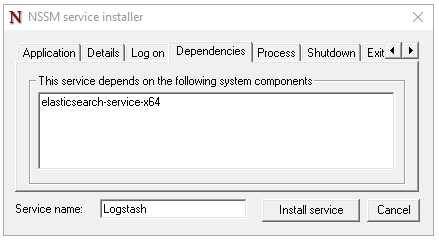
The reason for this step is that Logstash can do difficult if you have a Elasticsearch output but it is not actually running.
Now this is all so press on the “Install service” button to finish setting up a service for Logstash.
If you wish to adjust java related Logstash settings such as memory you can do this in the file “logstash-5.4.0\bin\setup.bat”.
As final step we require the beats plugin so we can run our shippers.
Open a “Command Prompt” or a “powershell” window and run the following command:
C:\ulyaoth\logstash-5.4.0\bin\logstash-plugin install logstash-input-beats
You should see a CMD popup like this:

You now have installed and configured Logstash.
3. Kibana
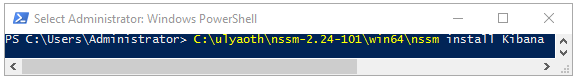
We will once again use NSSM to create a service for Kibana so start with opening powershell and running the following command:
C:\ulyaoth\nssm-2.24-101\win64\nssm install Kibana
Like this:
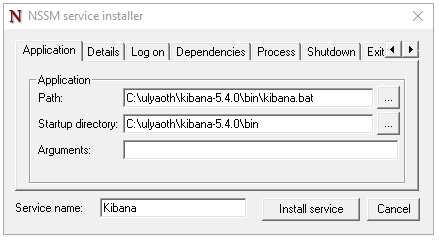
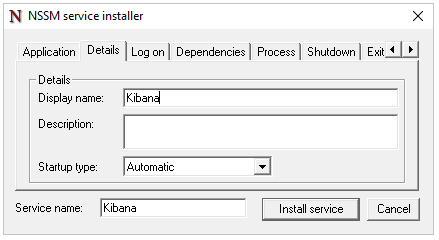
You will now see a GUI to create a service on the first tab “Application” fill in the following:
Path: C:\ulyaoth\kibana-5.4.0\bin\kibana.bat
Startup directory: C:\ulyaoth\kibana-5.4.0\bin
It should look like this:
If everything looks the same then go to the “Details” tab make sure it looks the same as below:
Now the following step is additional but recommended click on the “Dependencies” tab and add dependencies for:
elasticsearch-service-x64
Logstash
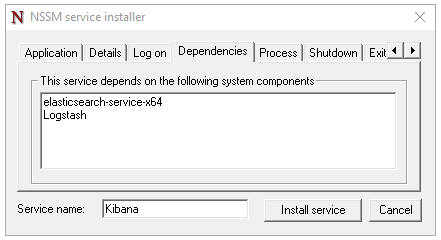
The reason for this step is that Logstash can do difficult if you have a Elasticsearch output but it is not actually running.
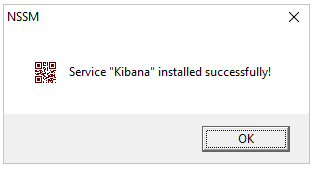
Now this is all so press on the “Install service” button to finish setting up a service for Kibana.
If you wish to adjust the settings of Kibana such as running it on a different port or IP simply go to “C:\ulyaoth\kibana-5.4.0\config\kibana.yml” and play around with the available settings.
Ofcourse make sure you adept IIS also if you chang the IP or Port.
This was all to have Elastic Stack installed now let’s make sure all services are actually started.
Simply open “Services” and make sure the following services are started:
Elasticsearch
Logstash
Kibana
Shippers:
All the Beats programs are installed the same way so I can simply show it once and then you know how to install them.
Open Powershell and run the following commands to make services from all the beats programs:
PowerShell.exe -ExecutionPolicy UnRestricted -File C:\ulyaoth\filebeat-5.4.0\.\install-service-filebeat.ps1
PowerShell.exe -ExecutionPolicy UnRestricted -File C:\ulyaoth\heartbeat-5.4.0\.\install-service-heartbeat.ps1
PowerShell.exe -ExecutionPolicy UnRestricted -File C:\ulyaoth\metricbeat-5.4.0\.\install-service-metricbeat.ps1
PowerShell.exe -ExecutionPolicy UnRestricted -File C:\ulyaoth\packetbeat-5.4.0\.\install-service-packetbeat.ps1
PowerShell.exe -ExecutionPolicy UnRestricted -File C:\ulyaoth\winlogbeat-5.4.0\.\install-service-winlogbeat.ps1
If you run this as a normal user you get a “Security warning” choose “R” for run once.
Now let’s download a newer configuration file for filebeat so it will ship the IIS logs to Kibana found on our github.
Open PowerShell and run the following command:
Start-BitsTransfer -Source https://raw.githubusercontent.com/sbagmeijer/tutorials/master/configs/windows/logstash/filebeat.yml -Destination C:\ulyaoth\filebeat-5.4.0\
Start-BitsTransfer -Source https://raw.githubusercontent.com/sbagmeijer/tutorials/master/configs/windows/logstash/packetbeat.yml -Destination C:\ulyaoth\packetbeat-5.4.0\
Start-BitsTransfer -Source https://raw.githubusercontent.com/sbagmeijer/tutorials/master/configs/windows/logstash/winlogbeat.yml -Destination C:\ulyaoth\winlogbeat-5.4.0\
In your beats folders you will find the files makes sure to read trough them so you understand it and so you can add additional things:
C:\ulyaoth\filebeat-5.4.0\filebeat.yml

C:\ulyaoth\packetbeat-5.4.0\packetbeat.yml

C:\ulyaoth\winlogbeat-5.4.0\winlogbeat.yml
Make sure to open all configuration files ant to tweak them to your needs, all shippers are installed with default values you have to configure it further for own specifics.
Additional step for Packetbeat:
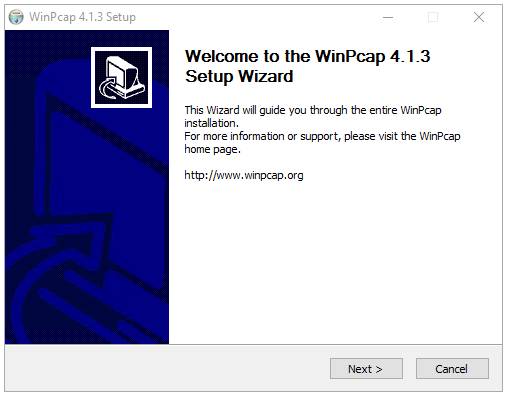
In order to run Packetbeat you also must install the program called “WinPcap” so go ahead and download this here:
WinPcap: http://www.winpcap.org/install/bin/WinPcap_4_1_3.exe
Double click the executable “WinPcap_4_1_3.exe” and you should see the following window:
Press on the button “Next” to continue and you will see the following window:
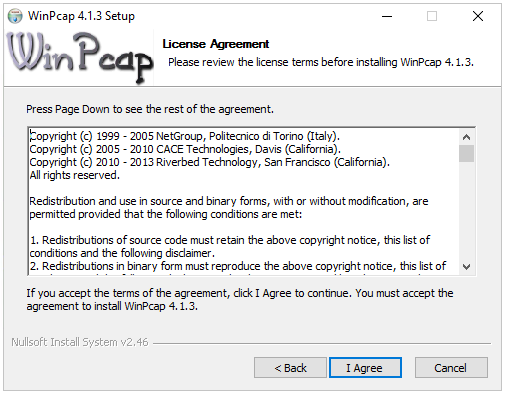
Make sure to read the full agreement and if you agree then press on the button “I Agree” and a new window will appear:
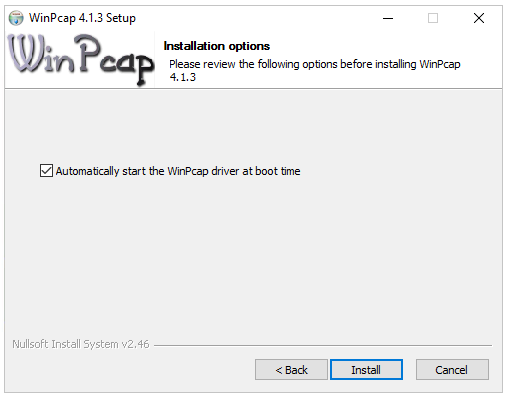
On this screen you can choose if you wish the service to autostart on boot or not, by default this is enabled and it is recommended you leave this since else Packetbeat would not start automatically, so continue and press the “Install” button.
The installation should be very quick and you will probably instantly see the following window:
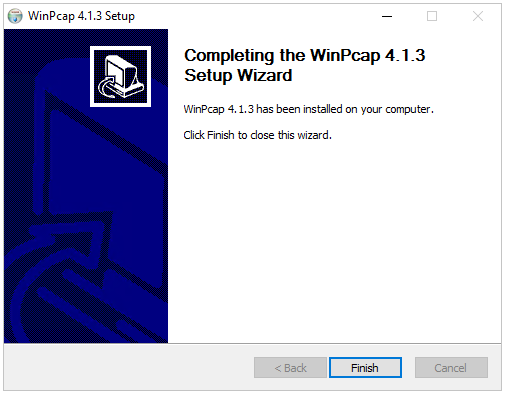
This means it installed successfully so press the “Finish” button to close down the program.
Now that you have installed all Beat services you have to make sure they are all started open the program “services.msc” and now start the programs:
filebeat
packetbeat
winlogbeat
metricbeat
heartbeat
Setup Kibana:
Congratulations you are now at the final part and all that is left is to configure Kibana so you will see the results of your hard work!
If you did everything correct then Kibana should now be running so lets test it by going to “http://loghost.ulyaoth.net/” or the website name you did choose and you should see that Kibana is started:
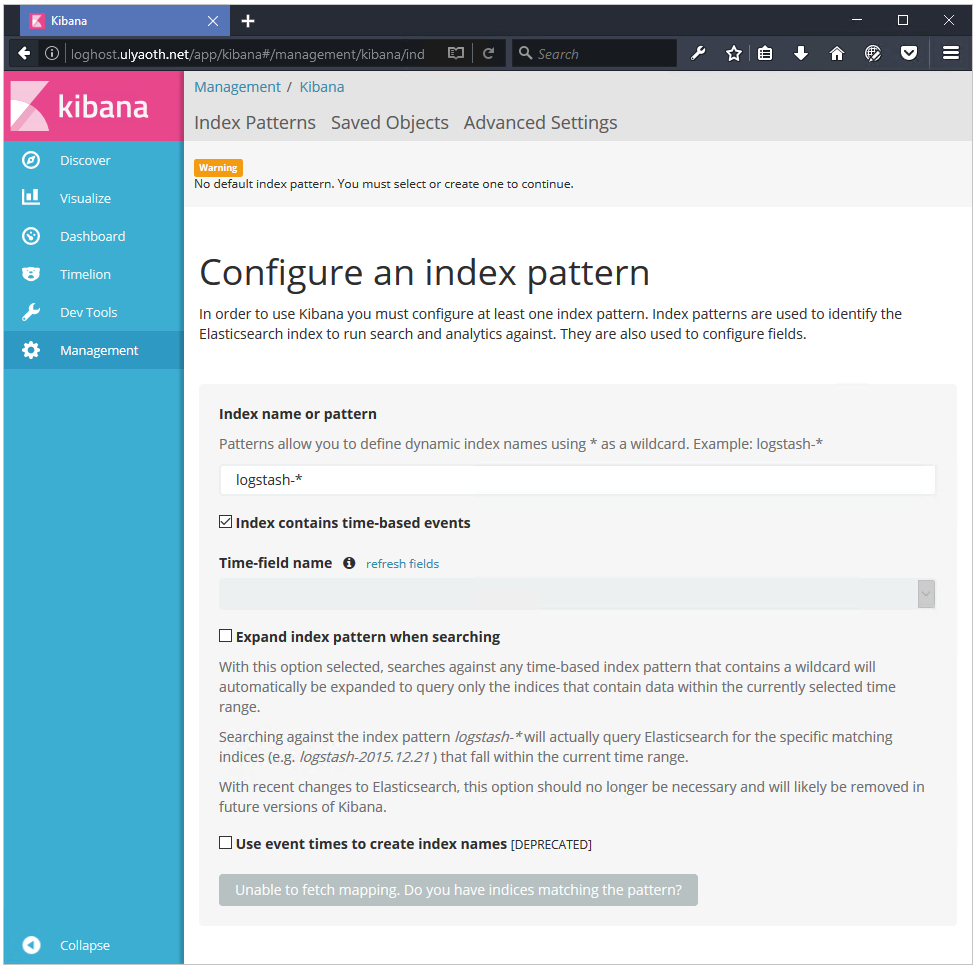
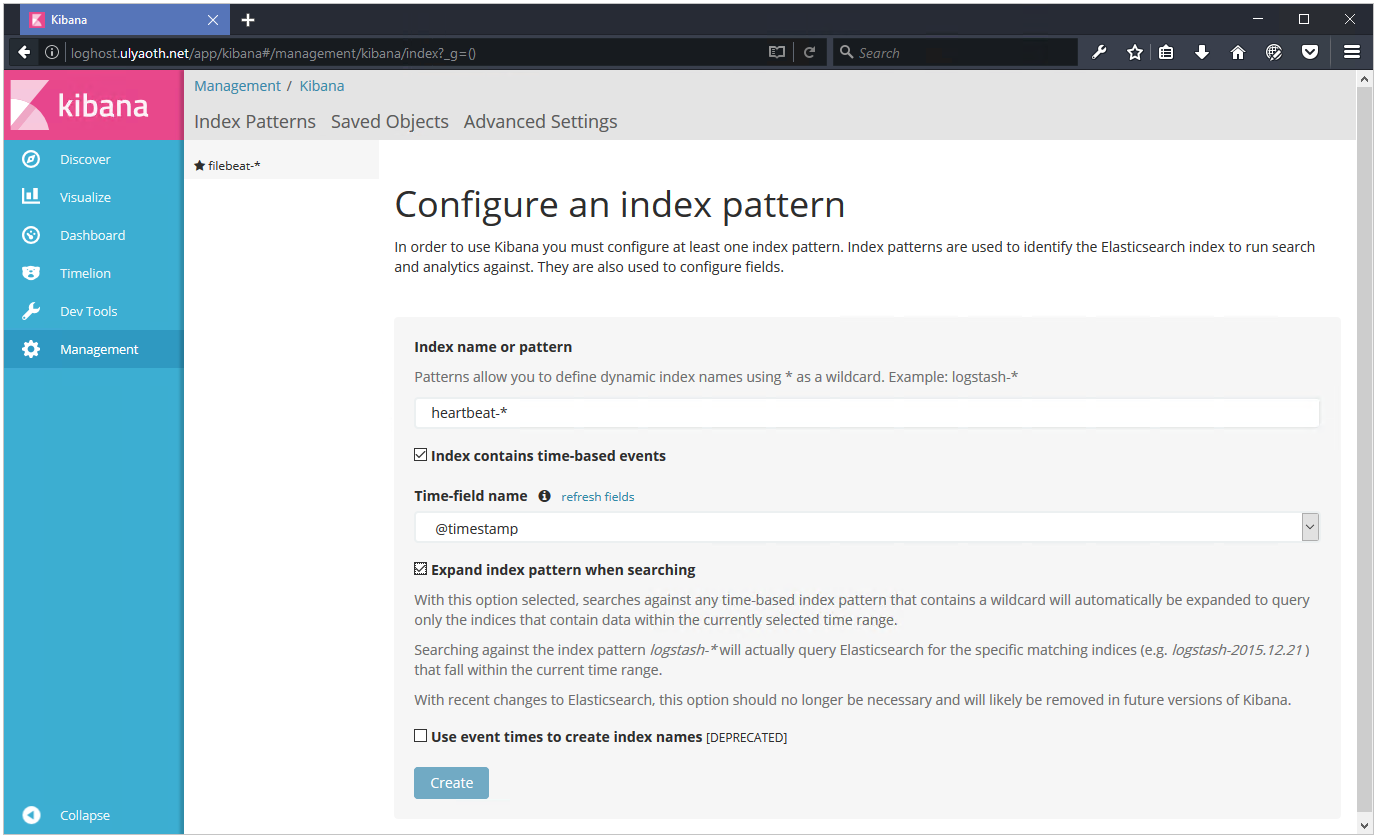
Now by default this will not work since the indexes we use are called after the beats so change the “Index name or pattern” to “filebeat-*” and no worries the other beat we configure later.

So when you have filled everything in exactly as me above then press on “Create”.
You now should see a window like this:
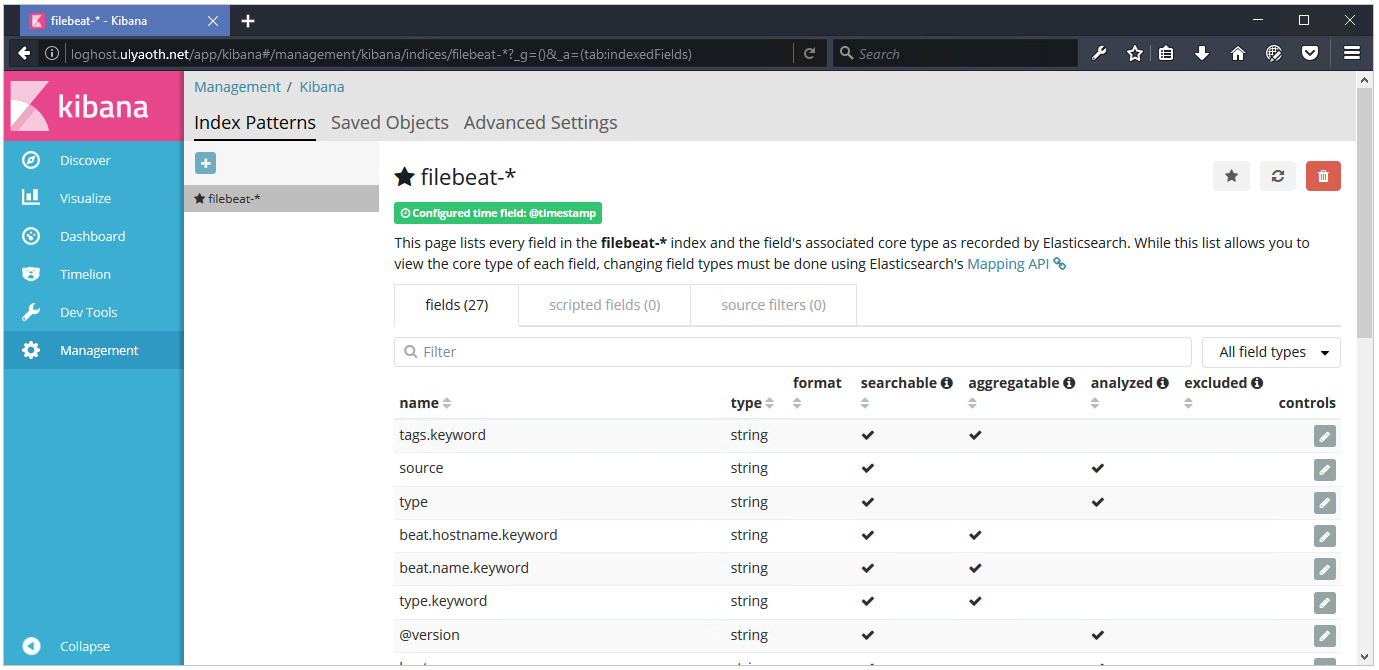
Now since we only created the “filebeat-*” index we have to make sure that Kibana does know of the other ones so looking at the image above we see a “+” above the “filebeat-* so click on this “+”.
You should now see the same window as when you first started Logstash:
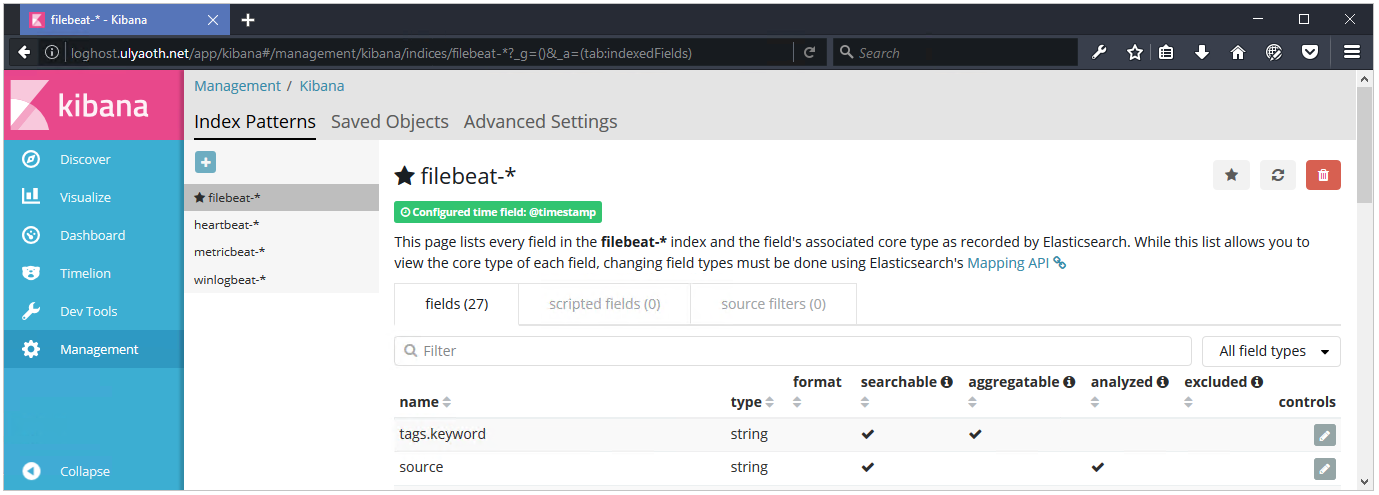
You should see “logstash-*” so change it to “heartbeat-*” like I did above.
Now repeat this process and add also:
metricbeat-*
packetbeat-*
winlogbeat-*
If you did it all correct your right top corner should now look like this:
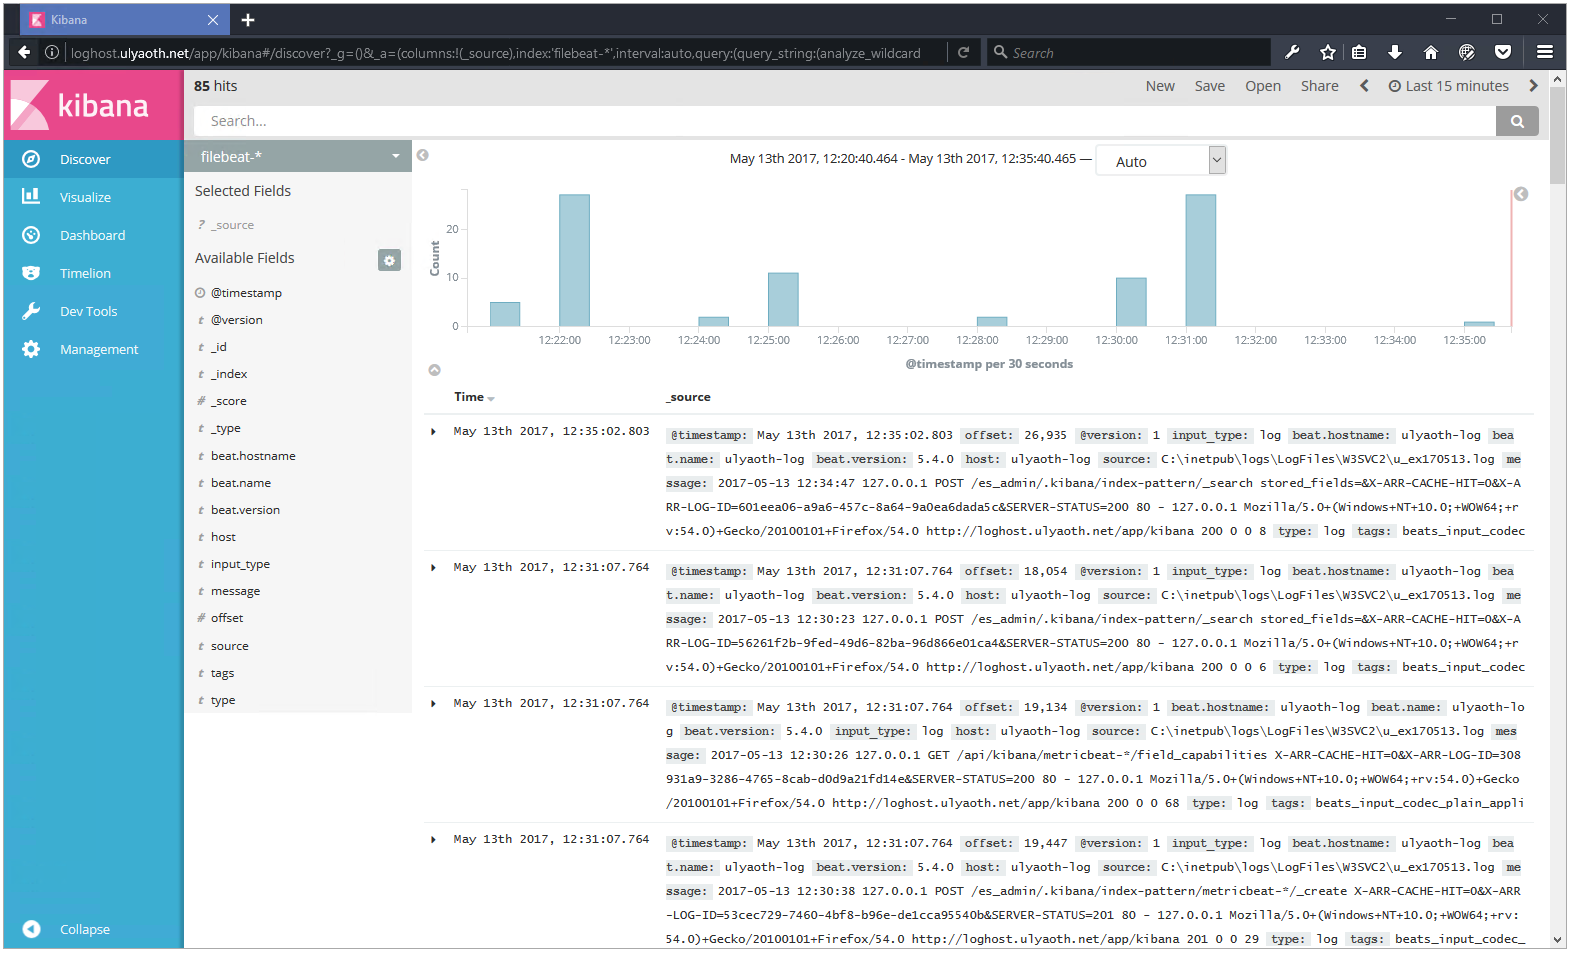
Well that is all to configure Kibana now click in the top on “Discover”.
By default your “filebeat-*” index will only show so you should see your Kibana IIS logs:
You can change trough your different indexes by clicking in your right top corner on the black bar that contains “filebeat-*” and then change your index to one of the other beats.
CONGRATULATIONS! You have a Elastic Stack running on Windows Server 2016.
Additional Troubleshooting Tips:
1. Always check in CMD if things not work, Logstash, Kibana and Elasticsearch give output in a terminal if you run it locally and this helps allot!.
2. Always check in “services.msc” is everything actually running I get many questions and then ES is not running for example.
3. Make sure your filebeat points to the correct log files.
4. Keep the versions of ELK intact as I write, many times there are updates that only work with certain versions of Elasticsearch for example.
I hope this helped someone!