
This guide should give you a good example of how to install Elastic stack on a Windows environment for anyone that is not interested in using Linux.
This guide was created by having all the applications on the same server, if you have different servers you have to think of the firewalls and you must alter the guide accordingly to fit your situation.
This guide was tested on:
Windows Server 2019
So let’s start!
Download all the requirements:
Elasticsearch:
https://artifacts.elastic.co/downloads/elasticsearch/elasticsearch-6.6.0.msi
Kibana: https://artifacts.elastic.co/downloads/kibana/kibana-6.6.0-windows-x86_64.zip
Shippers:
Packetbeat: https://artifacts.elastic.co/downloads/beats/packetbeat/packetbeat-6.6.0-windows-x86_64.zip
Winlogbeat: https://artifacts.elastic.co/downloads/beats/winlogbeat/winlogbeat-6.6.0-windows-x86_64.zip
Metricsbeat: https://artifacts.elastic.co/downloads/beats/metricbeat/metricbeat-6.6.0-windows-x86_64.zip
Heartbeat: https://artifacts.elastic.co/downloads/beats/heartbeat/heartbeat-6.6.0-windows-x86_64.zip
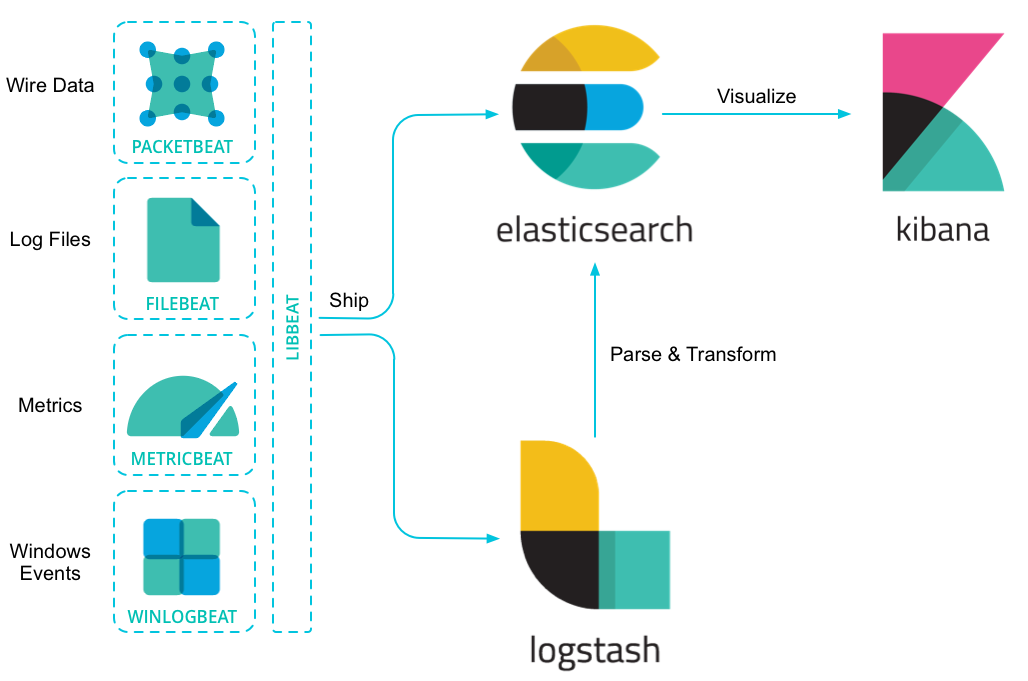
In short explained:
Packetbeat is for analyzing your network data.
Winlogbeat is for shipping windows event logs.
Metricbeat is for shiping and analyze metrics.
Heartbeat is for uptime monitoring.
Service manager:
DeamonMaster: https://github.com/TWC-Software/DaemonMaster/releases
WinPcap: (Required for Packetbeat)
https://www.winpcap.org/install/bin/WinPcap_4_1_3.exe
DeamonMaster is required to make “Kibana” run as windows services.
Now just simply exact all the zip files to a folder that I created myself called “ulyaoth” in “c:\ulyaoth\” just o make things easier.
So for me it looks like this now:
c:\ulyaoth\kibana-6.6.0

c:\ulyaoth\heartbeat-6.6.0

c:\ulyaoth\metricbeat-6.6.0

c:\ulyaoth\packetbeat-6.6.0

c:\ulyaoth\winlogbeat-6.6.0
Please be aware this is the directory structure I use if you change the naming of the directories or files you have to update everything correctly in the guide to fit your situation.
To continue we first will need to install a Java JDK version on the server as this is required by the packages of Elastic Stack.
Installing Java JDK:
Download the JDK version of Java and install it.
Go to the Java website: https://www.oracle.com/technetwork/java/javase/downloads/jdk11-downloads-5066655.html
(Since Oracle updates Java frequently please download the latest and ignore if my version is slightly older in the images that follow)
Accept the license and then download: “Windows x64 (jdk-11.0.2_windows-x64_bin.exe)” package.
Now install it by double clicking the file.
You should now see:
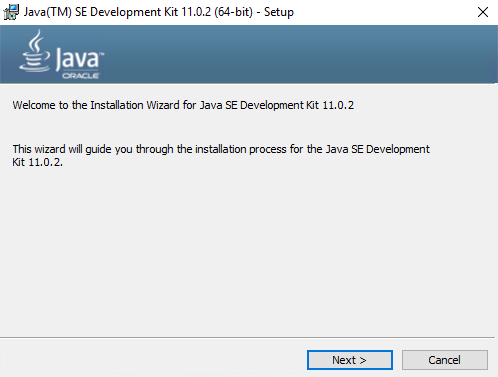
On this window press “Next” to see the next window.
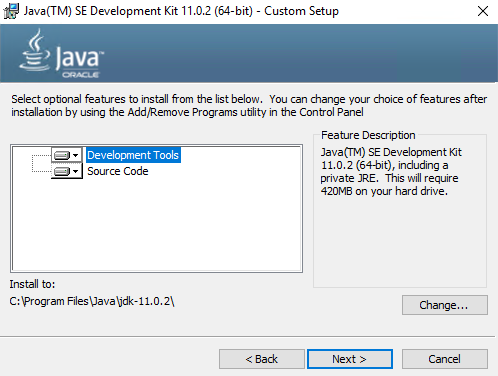
On this windows press again on the “Next” button to come to the next window.
This window means it is installing Java so wait till it completes and you will see a new window.
Congratulations, Java is now installed so press the “Close” button.
Now let’s add the JAVA_HOME variable to the server by simply right clicking on “This PC” and choose “Properties”, you should see the following screen:
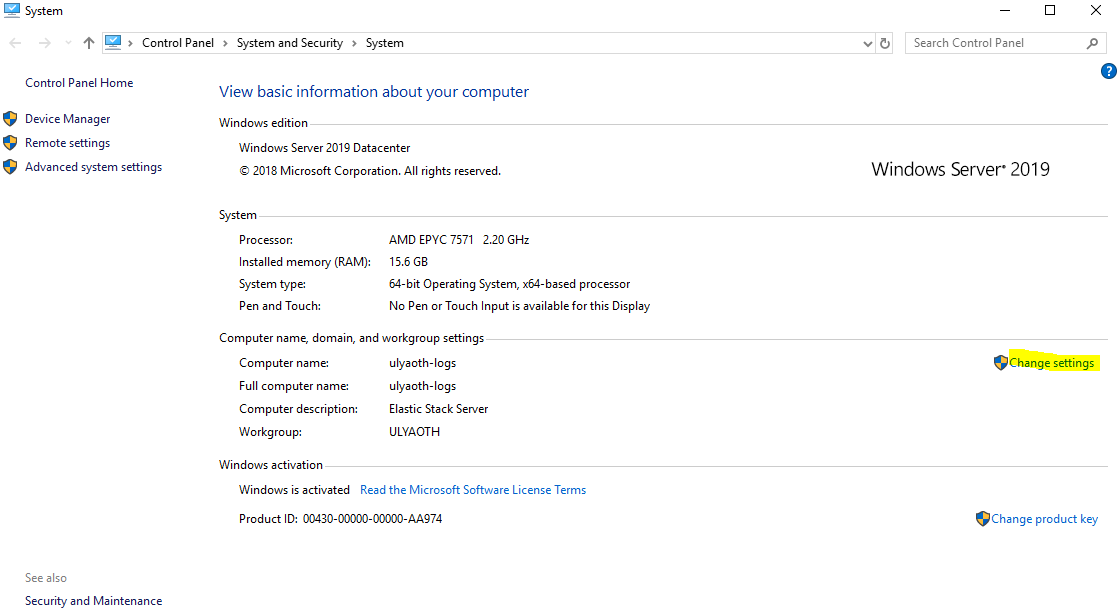
Now press on “Change settings” (marked yellow on the screenshot) and go to the advanced tab:
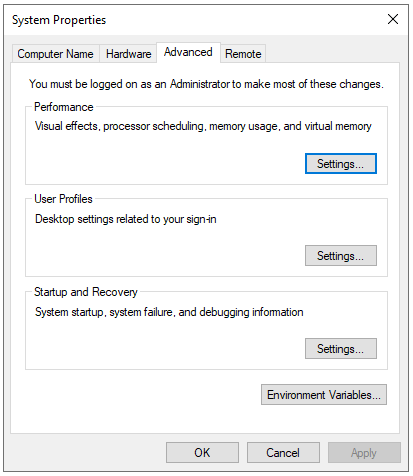
On this tab click on “Environment Variables…” button, then at below the “System variables window click on the “New…” button and fill it in as follows:
Variable Name: JAVA_HOME
Variable value: C:\Program Files\Java\jdk-11.0.2
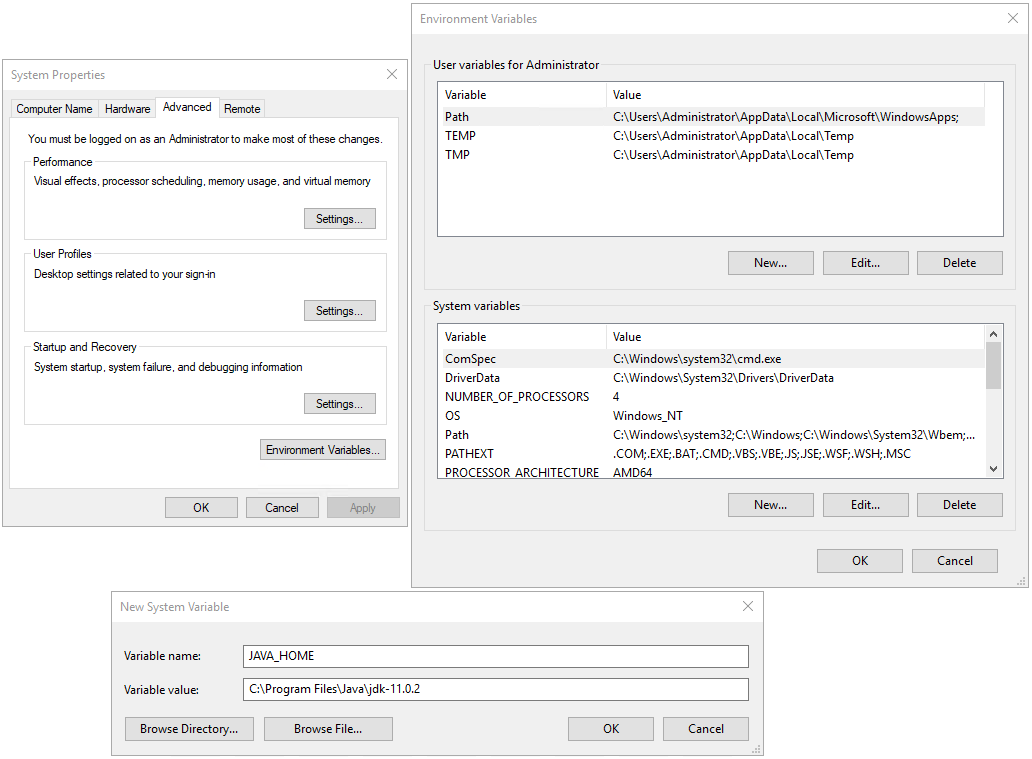
If it looks the same as above then press 3 times on the “OK” button to close all windows.
Congratulations you now finished installing Java and setting it up so any program in Windows is able to use it.
Now in order to use Kibana, it is not advisable to just put this directly onto the internet so we will use IIS as a reverse proxy.
Prepare IIS:
Open Server Manager:
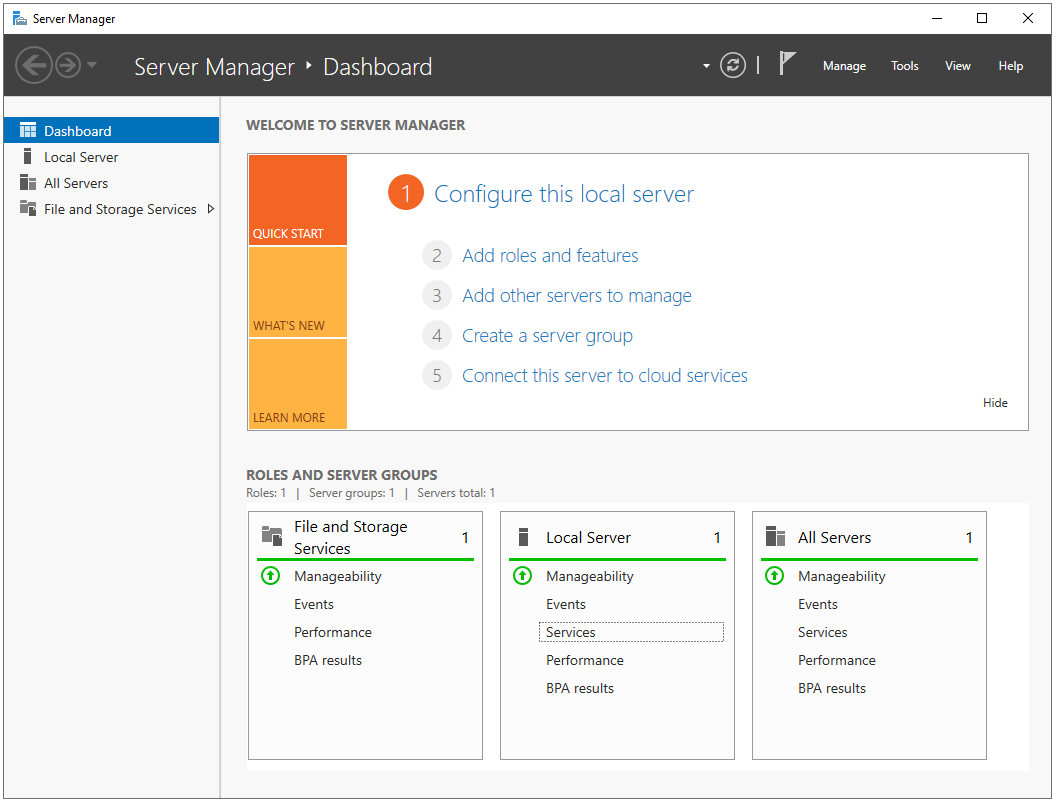
Click on “(2) Add roles and features” and a new window should appear:
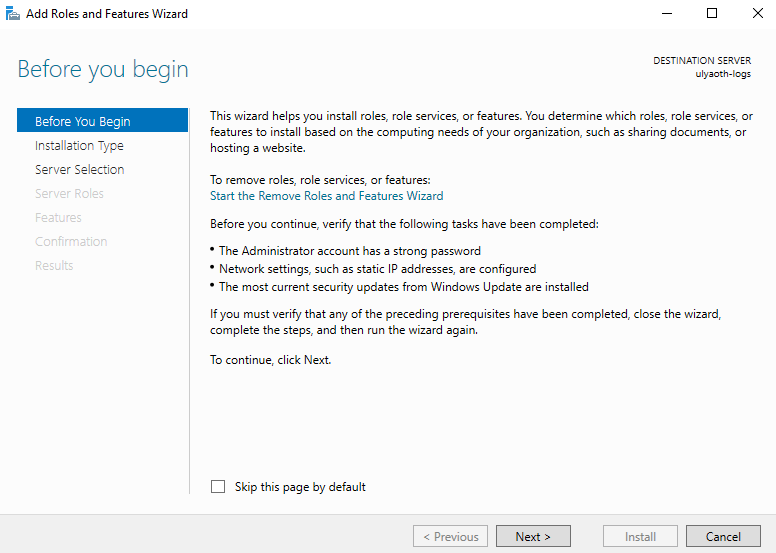
On this page press on “Next” to go to the next window.
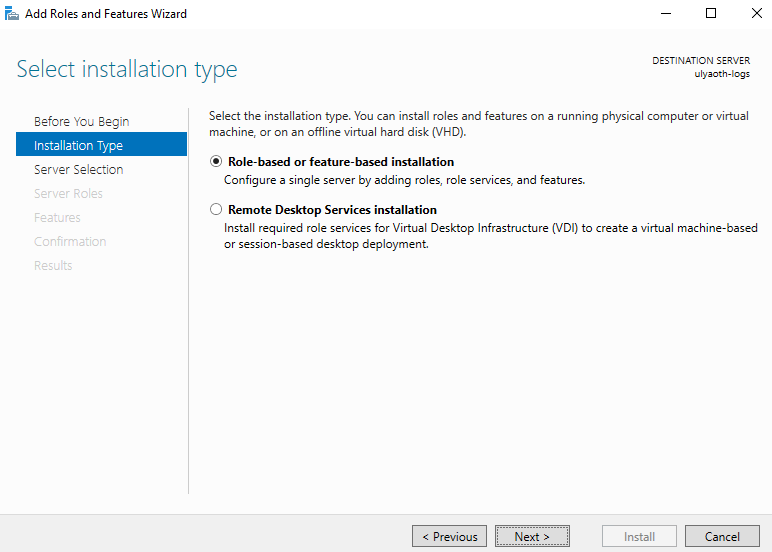
On this page leave the default selection “Role-based or feature-based installation and press “Next” again.
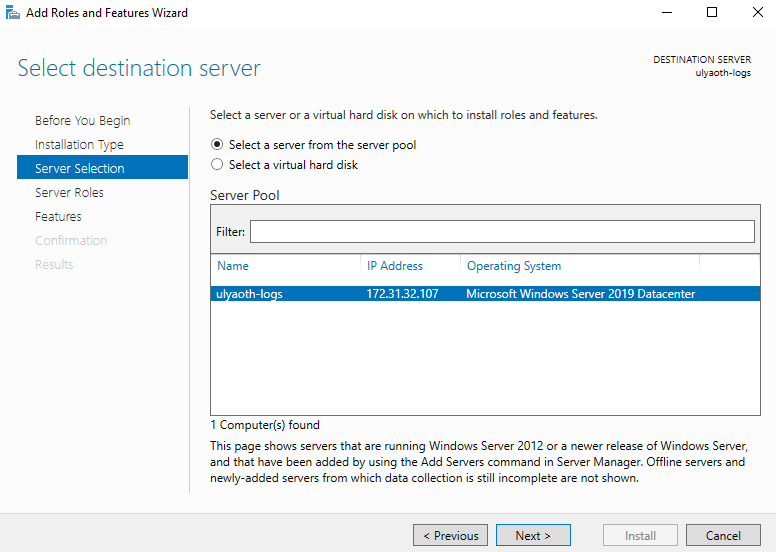
For me, all settings are fine here if that is the case for you also then press on “Next” again to go to the next window.
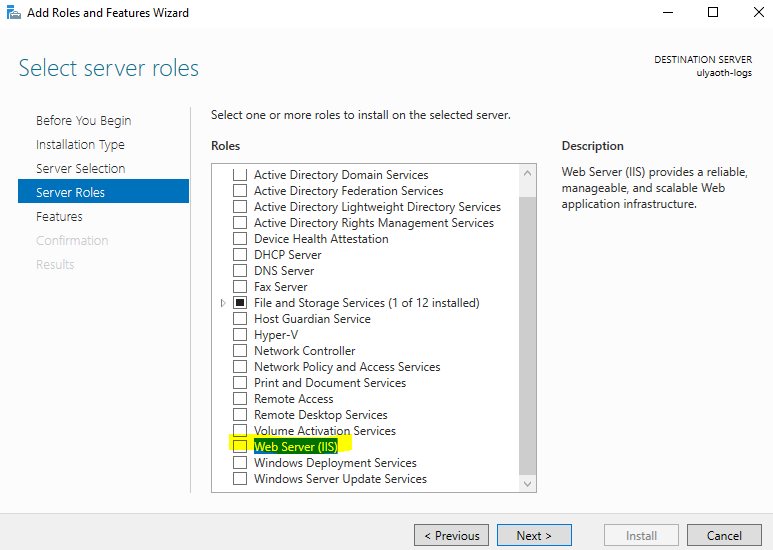
On this window scroll down till you see “Web Server (IIS) the one I a yellow line on and then click the select box in front of it, this will make a new window to open:
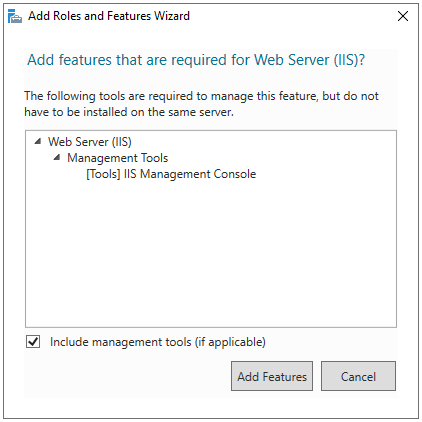
Simply press the “Add Features” button and you come back at the previous image where you can now press “Next”.
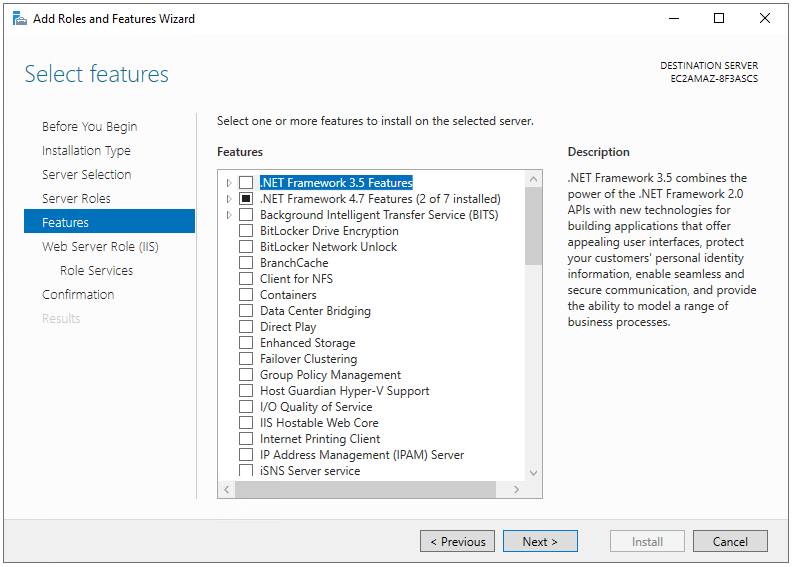
Here you can choose to install additional features however we do not require it for this guide so simply press “Next”.
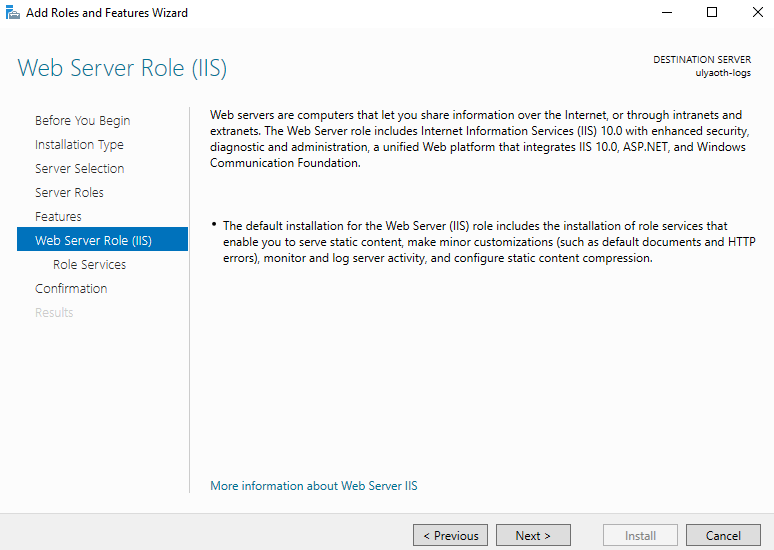
On this informative page press “Next” again.
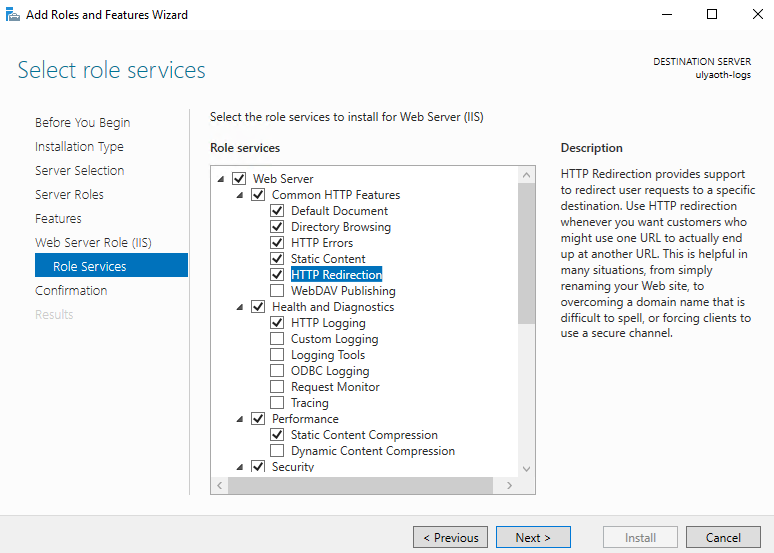
On this page you can select options for your IIS web server you can go through them and select what you like, normally I at-least select “HTTP Redirection” as it is a useful option, you can select it by clicking the selection box.
if you need nothing else press “Next” again.
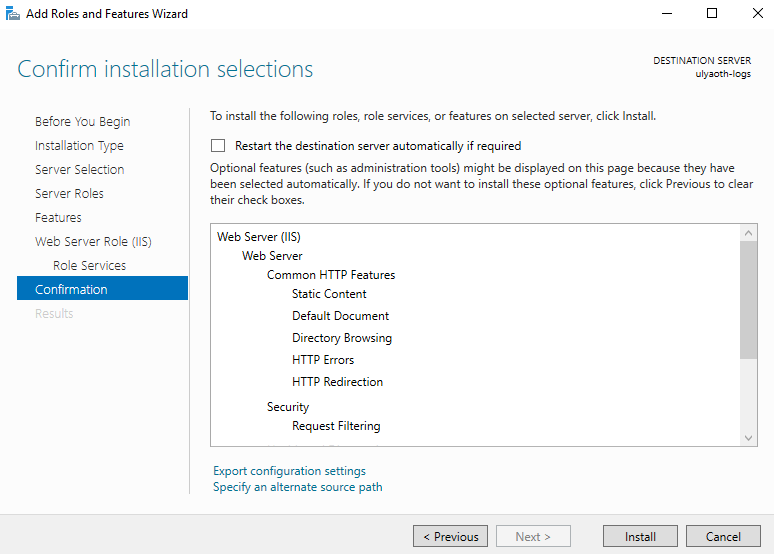
This confirmation window shows everything that will be installed so double check it so you do not install things you do not wish and then press the “Install” button to start the installation and you will see the following window:
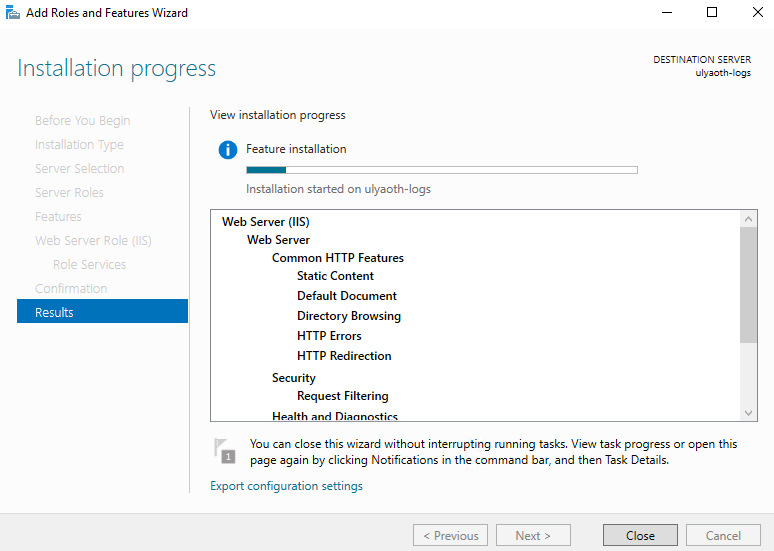
Just let it go and when the bar is fully blue and says it is finished press the “Close” button.
IIS is now fully installed and ready to be used.
Now we also have to install Microsoft Web Platform Installer so go to the following website and you should download a file called “WebPlatformInstaller_amd64_en-US”:
https://go.microsoft.com/fwlink/?LinkId=287166
Double click on “WebPlatformInstaller_amd64_en-US” and you will see the following:
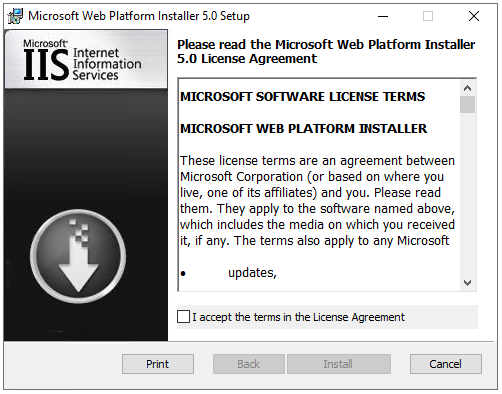
Click the box before “I accept the terms in the License Agreement” and then click on “Install”, and after a while, you see the following:
Just click on “Finish” and you should be done with installing the “Microsoft Web Platform”.
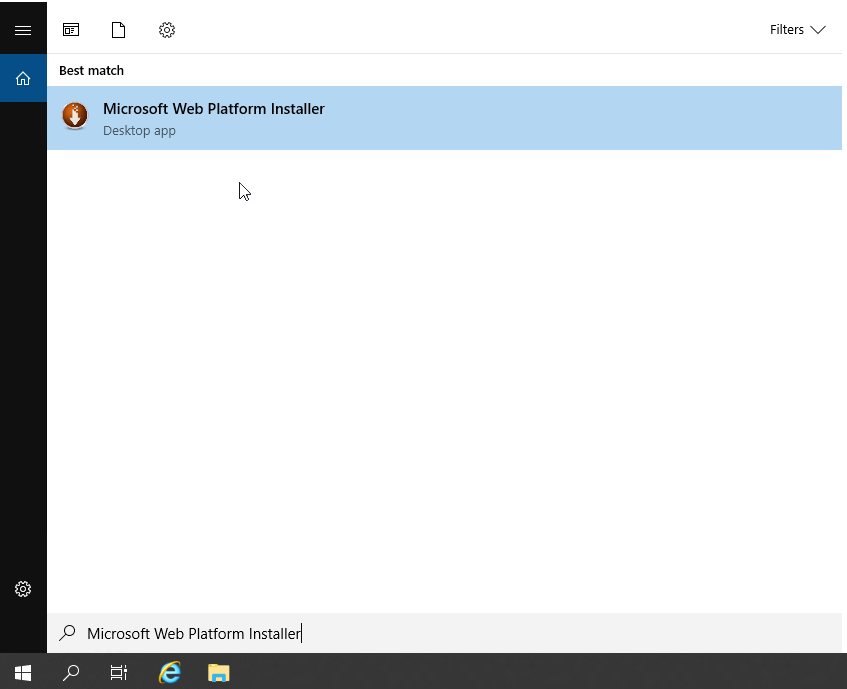
Now click on the “Search” button in the bottom of your taskbar and search for “Microsoft Web Platform Installer”:
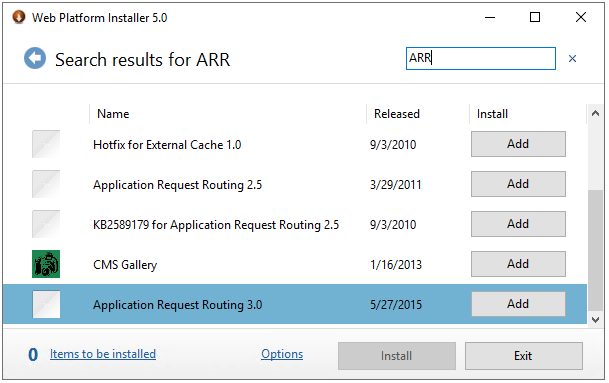
Open the application and in the search box type ARR and press the enter key, you will see a list of applications that match your search. The one we are interested in is “Application Request Routing 3.0” so find it in the list and press the “Add” button behind it:
Then use the search box again in the top but this time search for “URL Rewrite” you will see then the application “URL Rewrite 2.1” now press again the “Add” button behind it:
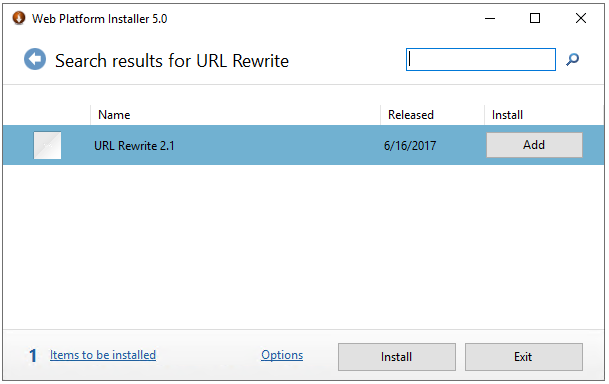
Now you have added the two additional applications we need you can go ahead and press the “Install” button and the following popup will appear:
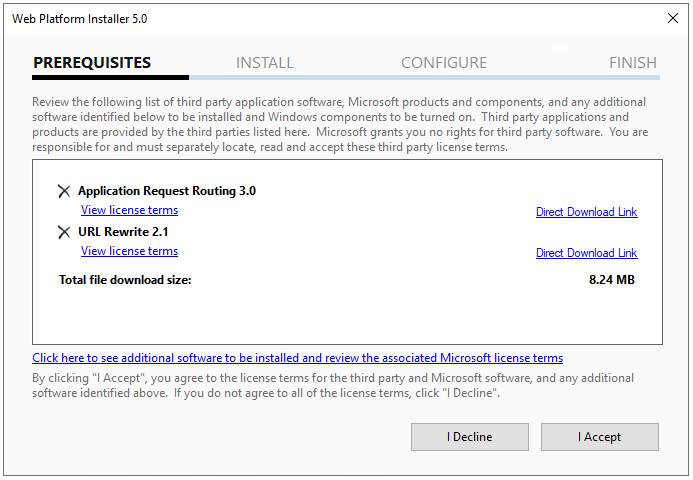
If everything looks fine as you selected press the “I Accept” button to start the installation it should look like this by now:
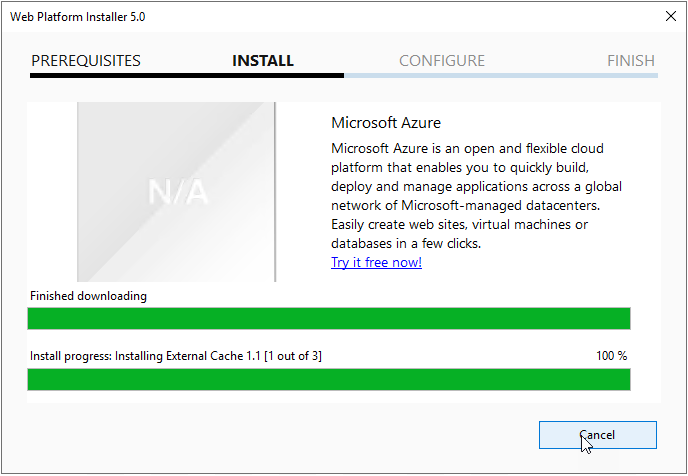
Once this window is finished it should show a new window confirming that everything is installed:
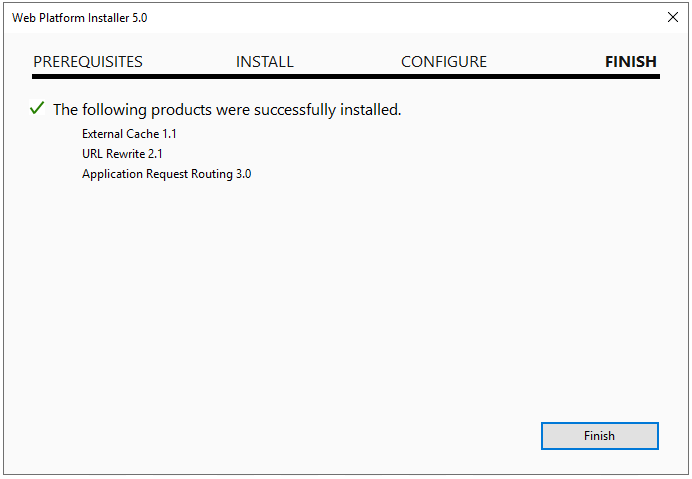
Just press on “Finish” to complete the installation and then on “Exit” to close the whole app.
Now before you continue with the following step first create somewhere a directory you wish to use for your website, this directory can be empty.
For my tutorial, I will use the default IIS directory located at: C:\inetpub\wwwroot
I do recommend you would create your own directory somewhere and include a simple index.html file that will show in case Kibana is not working.
Now open IIS Manager and you should see a window as below.
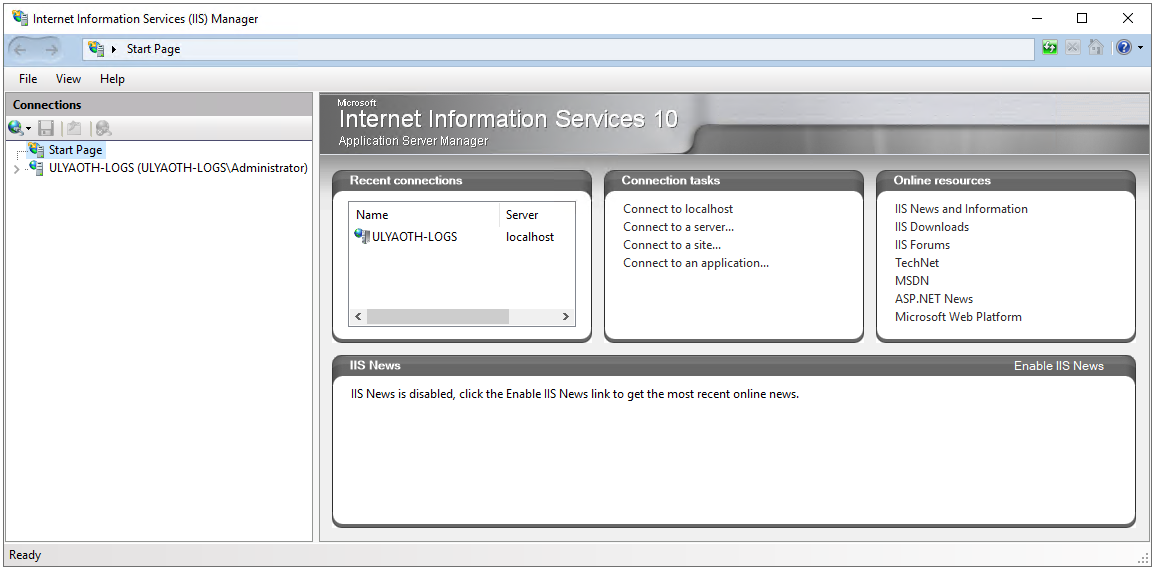
From this window, we will create a new website for Kibana in IIS.
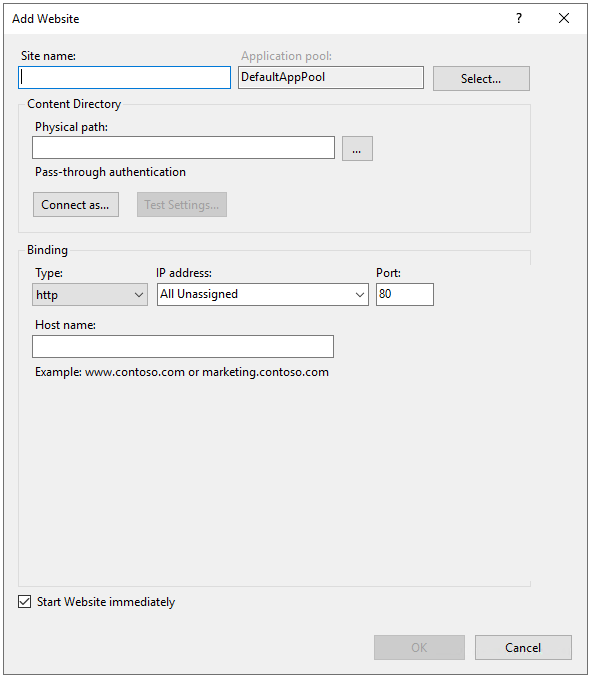
In the left window open up by clicking on your hostname, for me, this is “ULYAOTH-LOGS”. then right click on “sites” that just showed up and click “Add Website” and you will see a popup window like this:
(Extra note if you see an enabled “Default Web Site” you must stop this website or this tutorial won’t work “always” correctly)
You should fill it in as I did above with of-course “your” information if you wish to have SSL then change the “Type” field to “https” and select your SSL certificate at the option that will show. (we recommend you use SSL, we left it out of the tutorial, however)
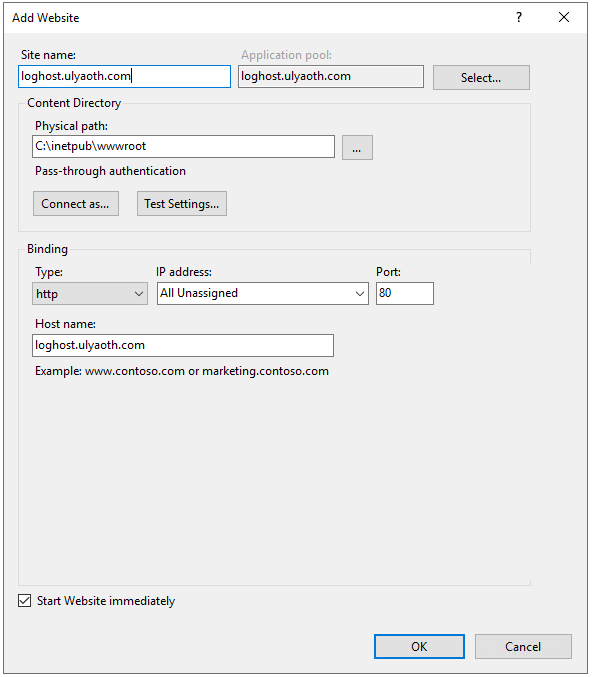
it is important to know the site and hostname this is something you have to alter to your own naming if you want to use my name you have to update your hosts file:
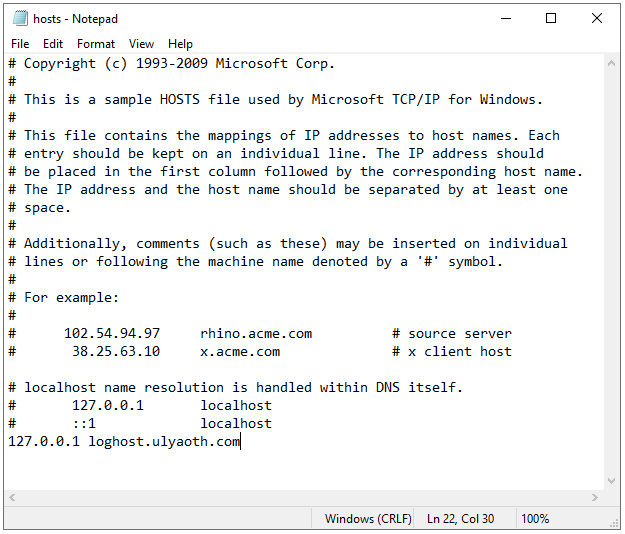
Open a PowerShell and type the following commands:
1. cd C:\Windows\System32\drivers\etc
2. notepad hosts
It should open notepad and in the bottom just add this:
127.0.0.1 loghost.ulyaoth.com
It should look like this:
And as the final part, we have to set up a reverse proxy in IIS to Kibana.
Click on your newly created name in the left window mine is called “loghost.ulyaoth.com” and then in the left window allot of icons will appear:
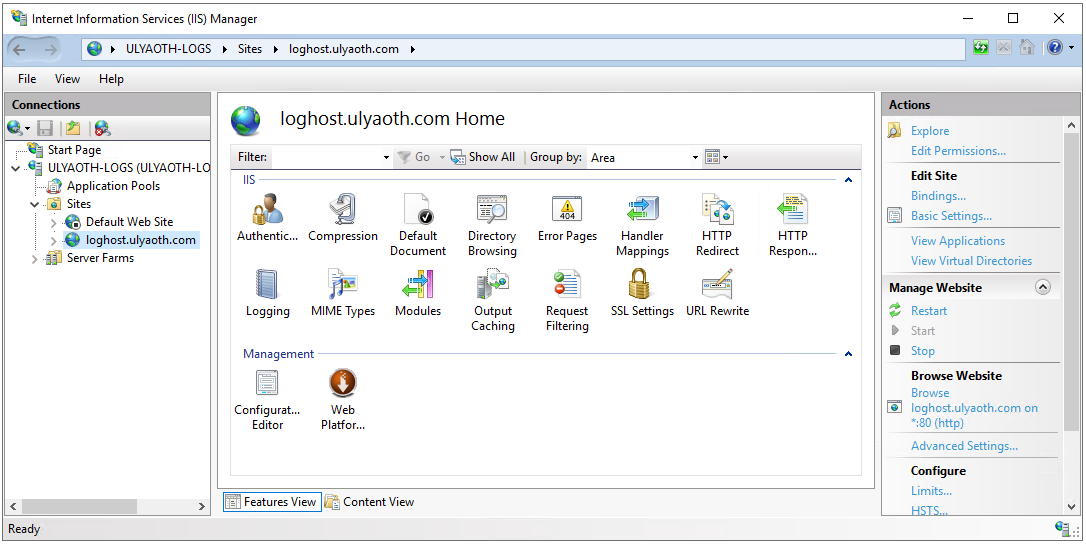
On the image above double click on the “URL Rewrite” and then you should see the following window:
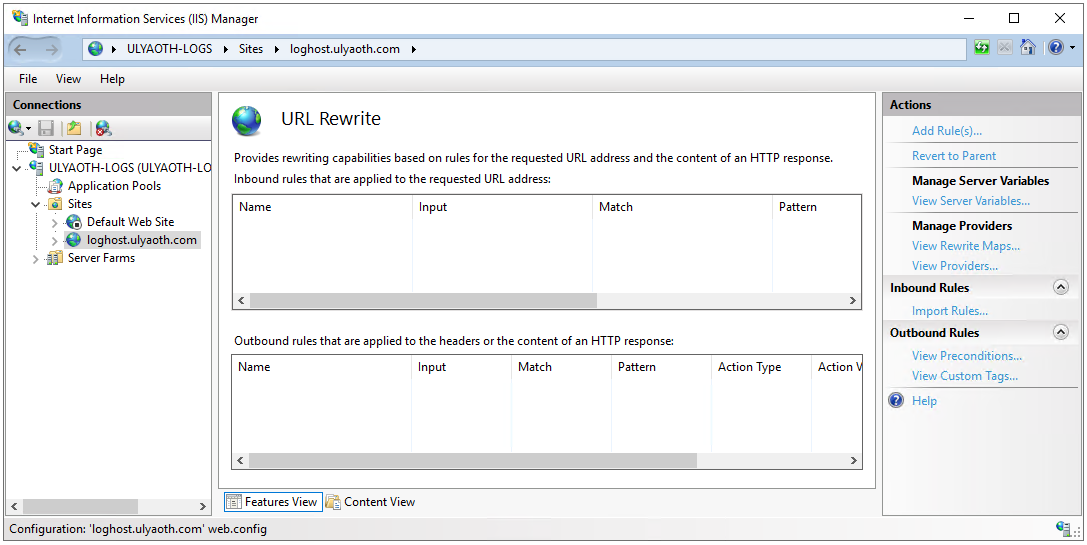
On the above image you this time click in the right menu on “Add Rules(s)…” you should see the following popup window:
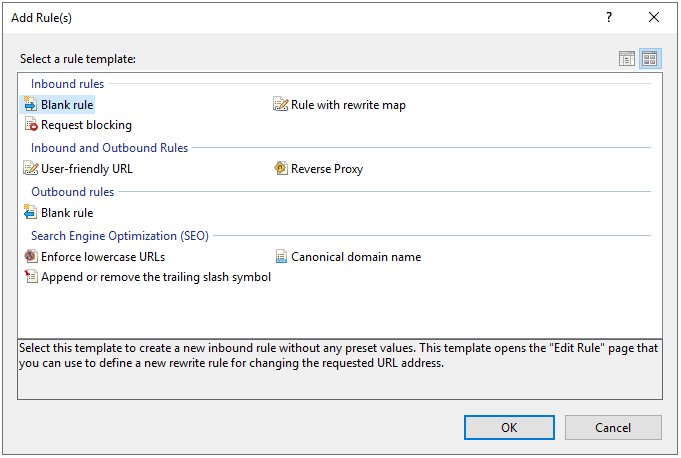
On this screen click on “Reverse Proxy” and then in the bottom on the “OK” button:
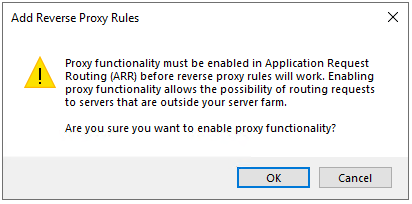
Read the warning to understand the impact of doing a reverse proxy and then press the “OK” button since we require this functionality.
You now will see a window where you fill in the reverse proxy information:
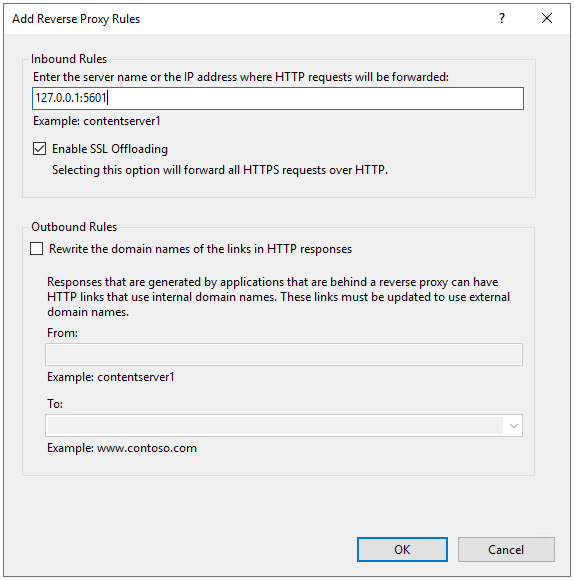
At this window make sure you fill everything in exactly as I did above:
Inbound Rules: 127.0.0.1:5601
If you did this you should have everything as I did so go ahead and press on the “OK” button.
To explain it in short the IP you entered “127.0.0.1” and port “5601” this is where Kibana will run on your server, since in my personal opinion it is not recommended to run Kibana directly towards the internet for security reasons and or you might need additional futures you let IIS be the link in-between since this is a well tested web-server.
You have come to the point where you have prepared the server by installing Java, IIS and created the reverse proxy for Kibana.
Now let’s move to the next objective to install Elasicsearch.
Elasticsearch:
Start by double-clicking the “elasticsearch-6.6.0.msi” file you downloaded, and you will see the following window:
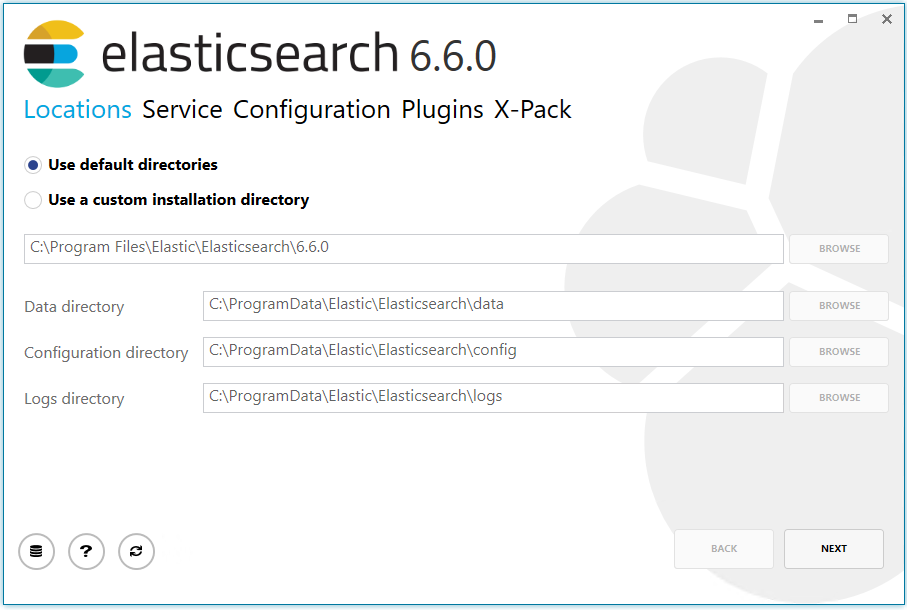
Now click on the “Next” button to see the following window:
For the purpose of this tutorial, we will leave everything default so just go ahead and click on the “Next” button again.
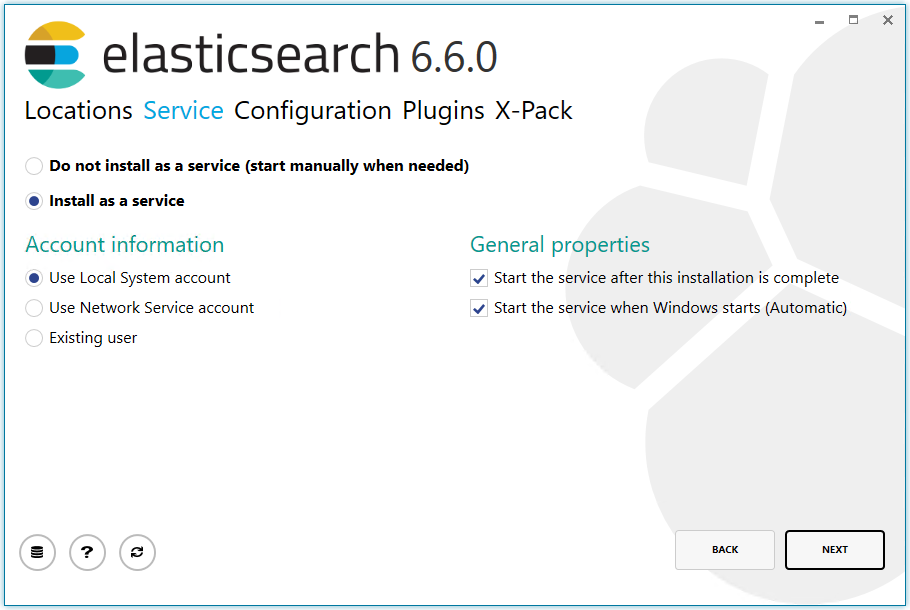
Since we will only use one server in this tutorial there is no need to add anything on this window, so again just click on the “Next” button to see the following window:
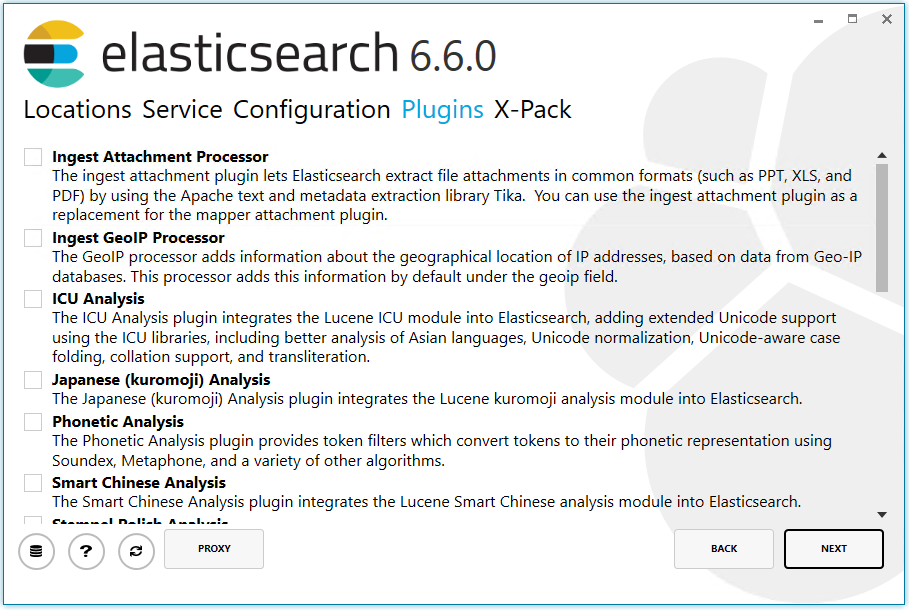
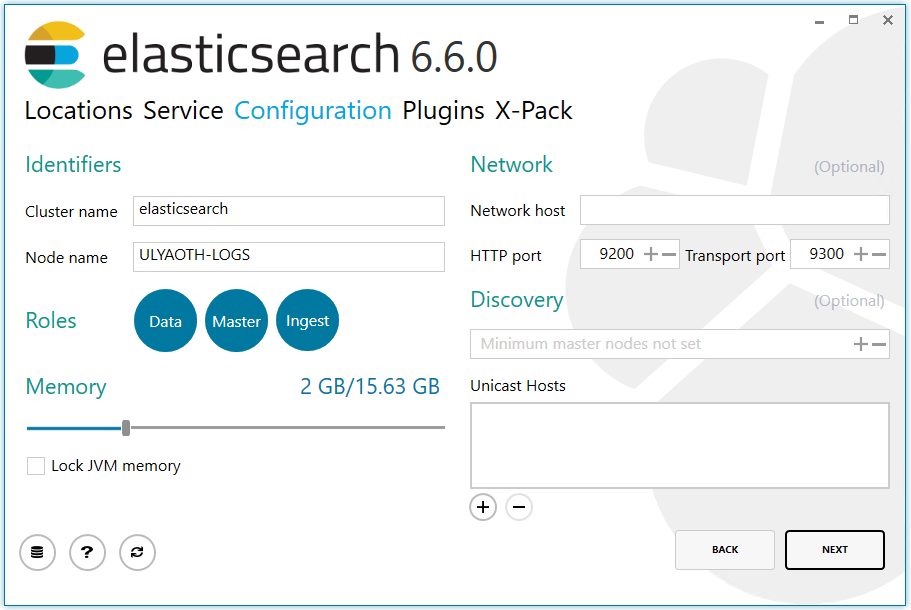
So normally here you perhaps want to add additional futures such as Asian language support, or if you will import log files from a web server you can add the GeoIP module to see where the IP is from. But in our case we again leave this default, so press once more the “Next” button.
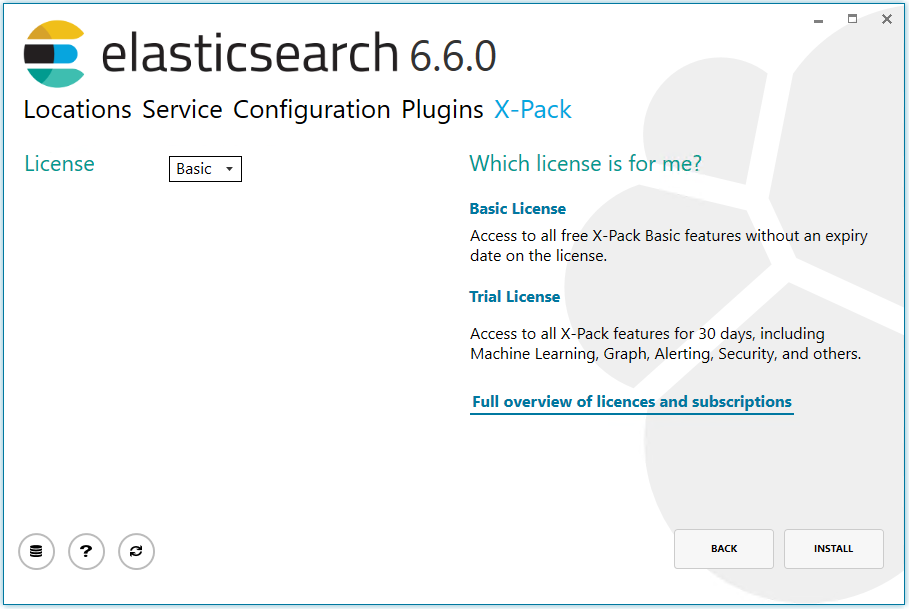
On the image above you can choose what license you will use for this tutorial we will use the “Basic” license, so you can click on the “Install” button.
You will now see it is installing and then after a while, you should see the following window that it was successful:
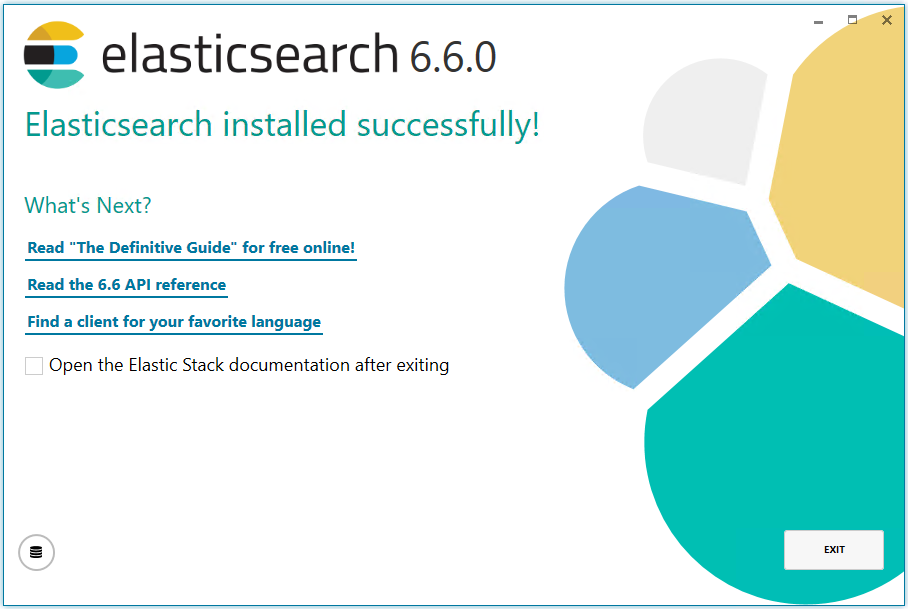
Congratulations Elasticsearch is now installed, so press the “Exit” button to close the installer application.
(For some strange reason I had to open PowerShell and perform the following commands:
cd C:\Program Files\Elastic\Elasticsearch\6.6.0

mkdir logs
And then start the “Elasticsearch” service in service, I think it is a bug in their installer.)
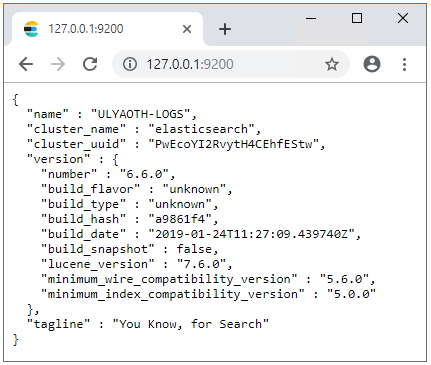
Now let’s test if Elasticsearch is all up and running by going to a browser and go to the URL “127.0.0.1:9200”.
Now in order to start Kibana as a windows service, we need to install a tool called DeamonMaster. So will now use the downloaded DeamonMaster from the start of the guide to create a service for Logstash.
Double click the file DaemonMaster_Setup_X.X.X.X and you will see something like this (change the X.X.X.X to the version you downloaded):
Click on the “Next” button and you will see the following window:
Check the box in front of the text “I accept the terms in the License Agreement” and then press the “Next” button.
Leave everything default on the above image and press the “Next” button once more to see the following window:
Press the “Install” button and after a while, you will see the following window:
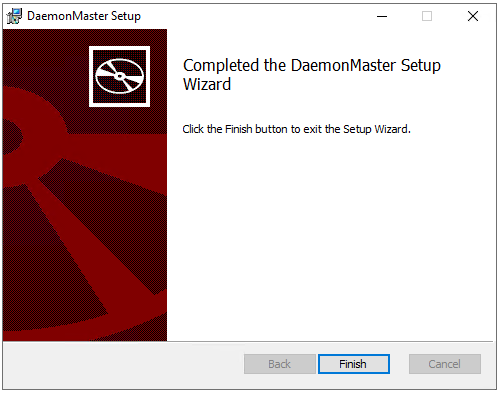
Congratulations you have now installed the “DeamonMaster” application, so press on “Finish” to close the application.
Now let’s create a Service for Kibana you can do this by double-clicking the DeamonMaster icon on your desktop to start it.
You will see a window that looks like this:
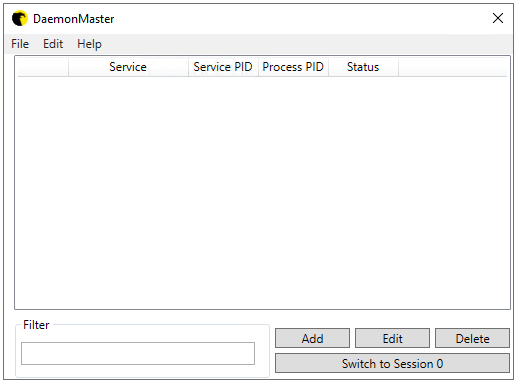
Click on the “Add” button and you will see a new window to create a service, please fill this in as you see on the below picture:
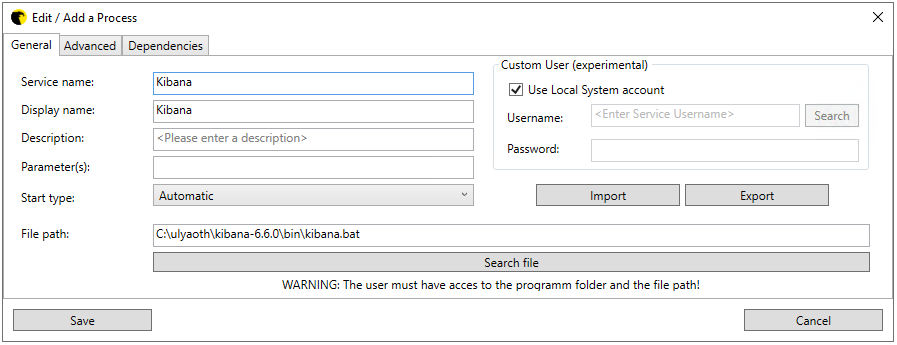
Now press the “Save” button and you will see a popup box with the text “Service-installation was successful”, just press on the “OK” button.
Now right click the “Kibana” service and choose “Start Service”, you will see again a popup window with the text “Service successfully started”, press again the “OK” button and you see that the service is started:
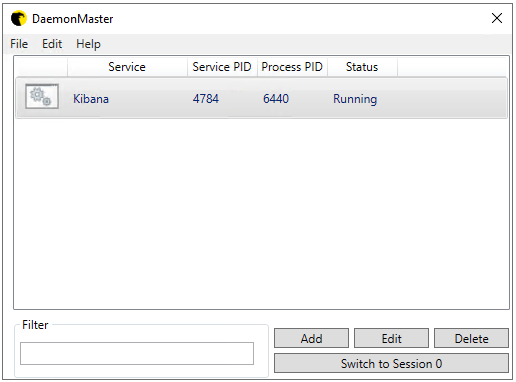
Press the “Save button again and you can close the application “DeamonManager”.
Now let’s test that Kibana is working and this will also test that your reverse proxy works in IIS.
In my case I simply browse to “loghost.ulyaoth.com”, you should browse to the domain name you did choose and you should see the following:
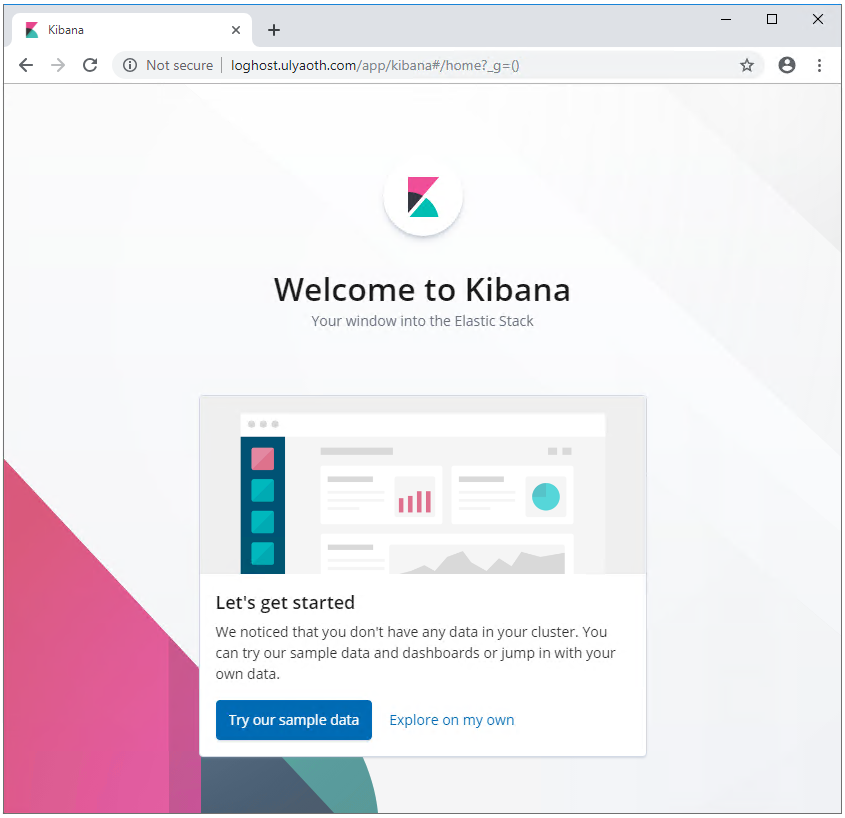
Great that shows Kibana is working, you can press the link “Explore on my own” to get to the real Kibana interface, on the Kibana interface you can click in the top of the page on “YES” or “NO” depending on if you want to help Elastic.
So now we only have to do one more step and that is to install the different beats to get actual data to your Elastic Stack installation.
Beats:
All the Beats programs are installed the same way so I can simply show it once and then you know how to install them.
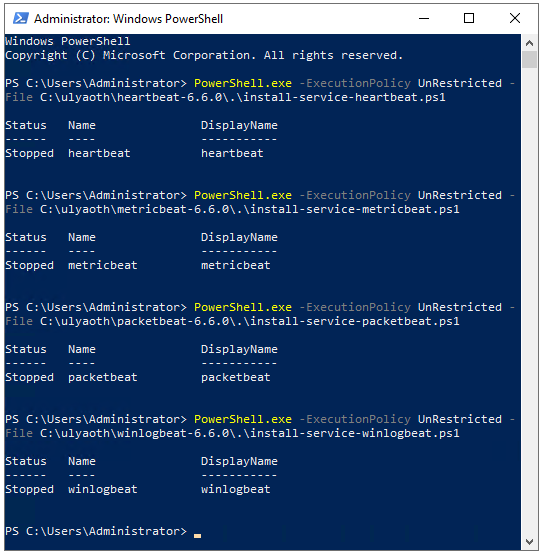
Open Powershell and run the following commands to make services from all the beats programs you wish to use, in our tutorial we will use at least the following beats:
PowerShell.exe -ExecutionPolicy UnRestricted -File C:\ulyaoth\heartbeat-6.6.0\.\install-service-heartbeat.ps1
PowerShell.exe -ExecutionPolicy UnRestricted -File C:\ulyaoth\metricbeat-6.6.0\.\install-service-metricbeat.ps1
PowerShell.exe -ExecutionPolicy UnRestricted -File C:\ulyaoth\packetbeat-6.6.0\.\install-service-packetbeat.ps1
PowerShell.exe -ExecutionPolicy UnRestricted -File C:\ulyaoth\winlogbeat-6.6.0\.\install-service-winlogbeat.ps1
If you run this as a normal user you get a “Security warning” choose “R” for run once.
If you did run all commands correctly you will see this:
Now there is one more step this is for Packetbeat to work, you need to install WinPcap we downloaded this at the start of this tutorial.
Start by double-clicking the file “WinPcap_4_1_3.exe” and you will see the following window:
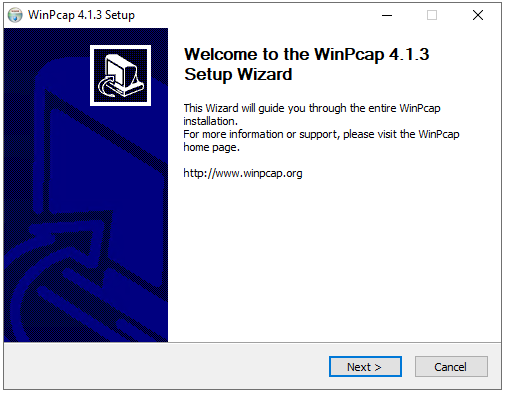
Click on the button “Next >” to see the following page:
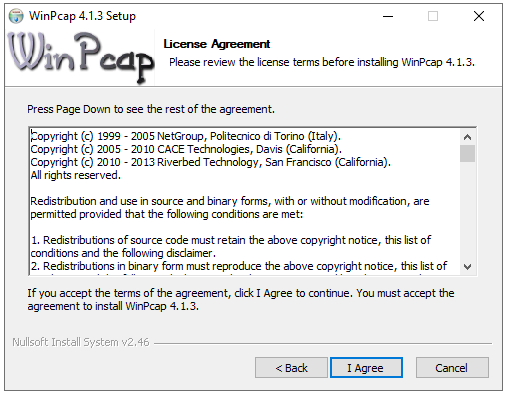
Read the agreement and if you agree with it then press on “I Agree” and you will see:
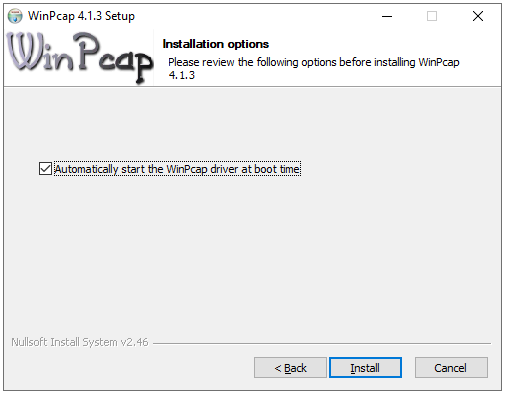
leave this screen as it is and press the “Install” button, once the installation is finished you will see the following final window:
You can press the “Finish” button to close the installation.
Now open “Services” and start the following services:
heartbeat
metricbeat
packetbeat
winlogbeat
Now go back to your Kibana window in your browser and press on the link “Connect to your Elasticsearch index”.
You will see a page similar to this:
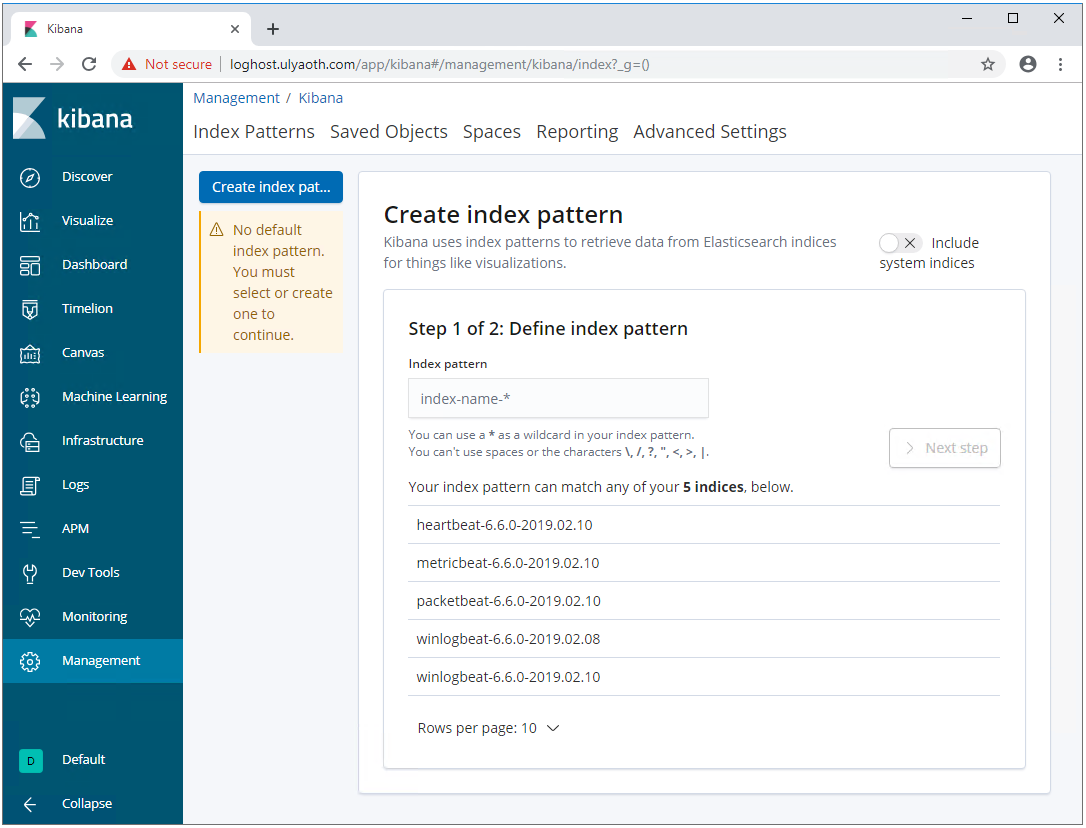
So you will need to make 4 indexes now for each of the beats you used in my case I will need to create:
heartbeat-6.6.0-*
metricbeat-6.6.0-*
packetbeat-6.6.0-*
winlogbeat-6.6.0-*
In a technical sense, you could get away with “heartbeat-*” for example, but you never know what could change in the next version of Heartbeat, and in this way, you know the log source will be the same and your dashboards won’t break.
So I will show you how to create the “heartbeat index now:
Fill in the following:
Index pattern: heartbeat-6.6.0-*
So it looks like this:
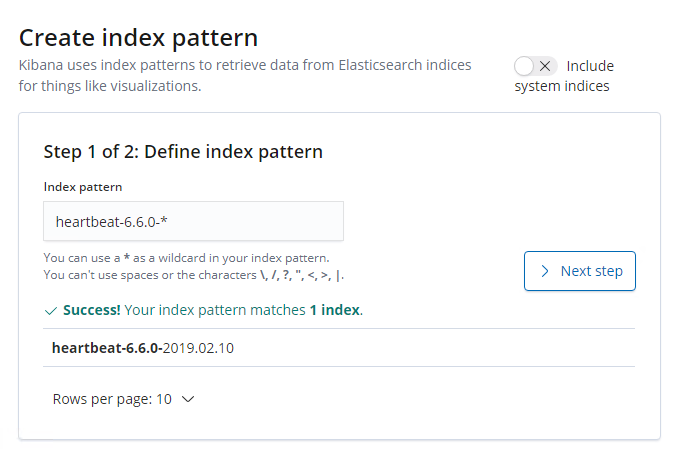
Now press on the button “> Next step” and you will see the following window:
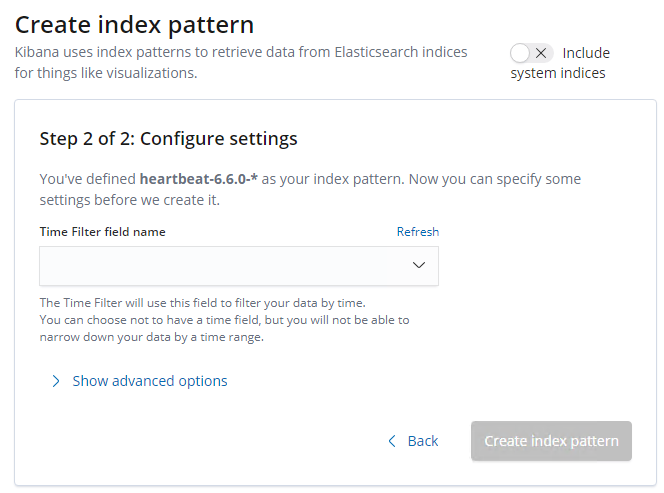
Now choose the following option:
Time Filter field name: @timestap
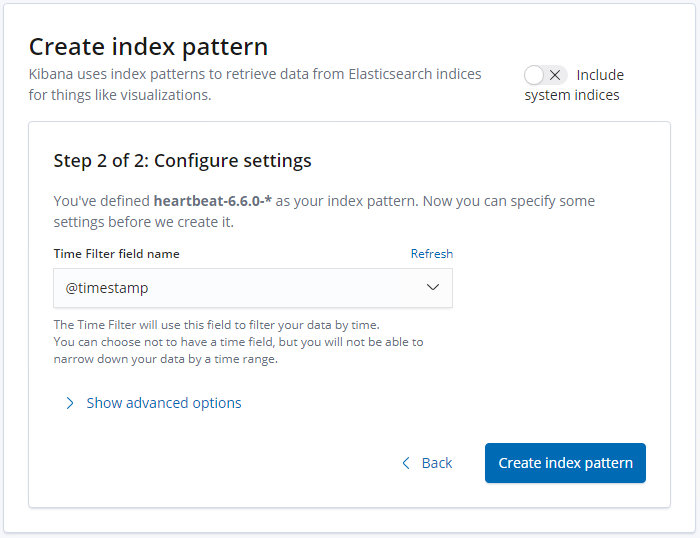
And press on the blue button called “Create index pattern” and you see your created index:
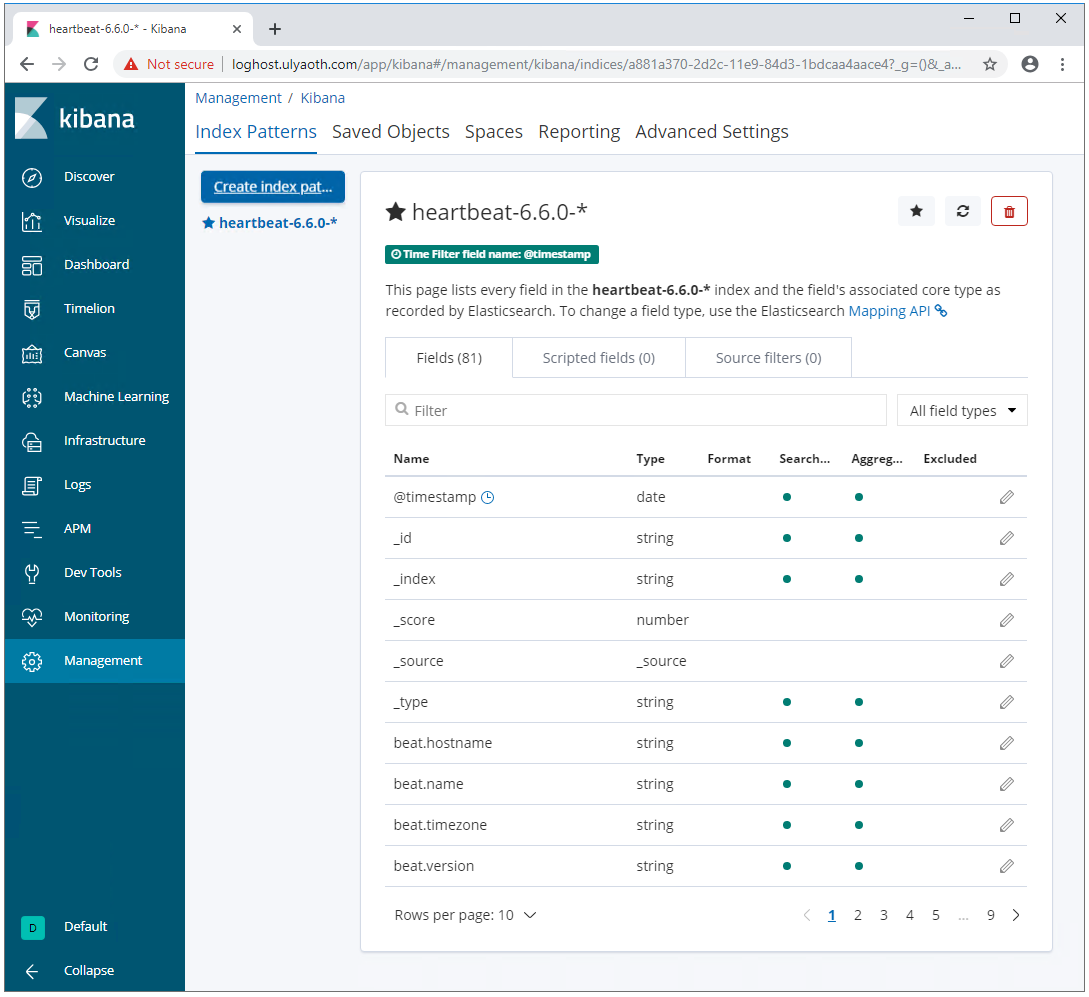
Now repeat this process by clicking on the blue button “Create index pattern” for:
metricbeat-6.6.0-*
packetbeat-6.6.0-*
winlogbeat-6.6.0-*
If you created them all you should so so in the left:
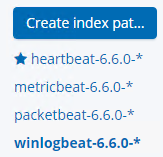
If you now click on the “Discover” button you should see your data:
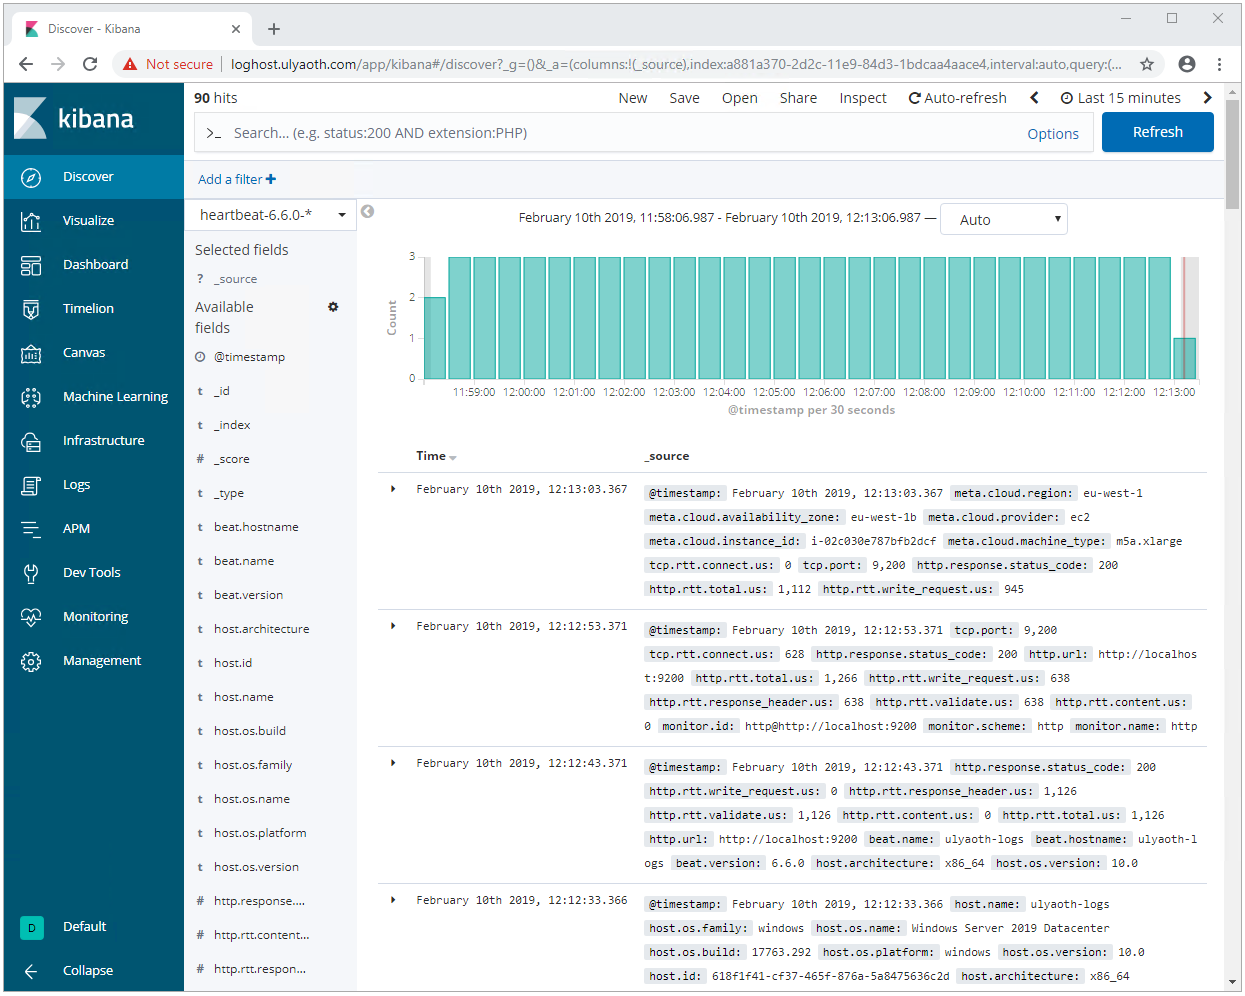
As you can see I did not install Logstash as there was not really a need for, but in case you wish also to have Logstash, then please use the Kibana steps as they are the same.
I hope that was interesting and good luck with Elastic Stack!