

***
Please be aware the Ulyaoth Repository has been discontinued! Please read:
https://ulyaoth.com/news/ulyaoth-repository-end-of-life/
You can still make this tutorial work but you will need to compile the packages yourself, please be aware our GitHub is not longer updated however: https://github.com/ulyaoth/repository
***
logstash-forwarder is no longer maintained, also Ulyaoth repository no longer provides Kibana
Small note:
If you want to ship logs from other servers all you have to do is install “ulyaoth-logstash-forwarder” on those servers and point the config to your logstash server.
In this guide I will provide an example of how to set up a Logstash server with a Kibana interface that does get the logs from logstash-forwarder. While there are multiple other ways to get logs into Logstash I will focus in this guide on logstash-forwarder only.
I am aware that in the new Logstash rpm everything such as Kibana is merged into one package, But I feel personally it is better to install things separate as this gives you the possibility to update certain parts when you want without having to wait for a new rpms.
If you are going to use this in a production environment then please make sure to check the security implications as Logstash requires a port to be open to get logs sent to the server.
So what is Logstash!?:
“Logstash is a tool for managing events and logs. You can use it to collect logs, parse them, and store them for later use (like, for searching). Speaking of searching, Logstash comes with a web interface for searching and drilling into all of your logs.”
There are a lot of examples on the official Logstash so I definitely recommend having a look there! Their website: https://www.elastic.co/products/logstash
Now let’s start, for this guide I will be using the following programs:
Fedora
Logstash 4
Logstash-Forwarder
ElasticSearch 4
Nginx
Kibana 4
Step 1: Import the Logstash and Elasticsearch GPG key.
$ sudo rpm --import http://packages.elasticsearch.org/GPG-KEY-elasticsearch
Step 2: Go to your yum repository directory.
$ cd /etc/yum.repos.d/
Step 3: Download the Logstash and Elasticsearch repository files.
$ sudo wget https://raw.githubusercontent.com/sbagmeijer/ulyaoth/master/guides/logstash/repository/logstash.repo

$ sudo wget https://raw.githubusercontent.com/sbagmeijer/ulyaoth/master/guides/logstash/repository/elasticsearch.repo
Step 4: Install the Ulyaoth repository to your server.
$ dnf install https://downloads.ulyaoth.net/rpm/ulyaoth-latest.fedora.x86_64.rpm
If you are using another Fedora or RHEL version please have a look here if your repository is supported: https://community.ulyaoth.com/resources/ulyaoth.2/
As we wrote before the Ulyaoth repository no longer provides Kibana, so please download this from the official elastic website instead.
Step 5: Install all required packages
$ sudo dnf install -y ulyaoth-nginx ulyaoth-kibana ulyaoth-logstash-forwarder java elasticsearch logstash rsyslog tar wget policycoreutils-python zip
Step 6: Reload the systemd daemon.
$ sudo systemctl daemon-reload
Step 7: Go to the Logstash config directory
$ cd /etc/logstash/conf.d
Step 8: Download the following Logstash config file
$ sudo wget https://raw.githubusercontent.com/sbagmeijer/ulyaoth/master/guides/logstash/logstash-forwarder/conf/logstash.conf
Step 9: Change the ownership of the Logstash config file
$ sudo chown logstash:logstash logstash.conf
Step 10: Create the following directories:
$ sudo mkdir -p /var/log/nginx/kibana
Step 11: Change the owner ship on the kibana nginx log folder.
$ sudo chown nginx:adm /var/log/nginx
Step 12: wget the kibana vhost file
$ sudo wget https://raw.githubusercontent.com/sbagmeijer/ulyaoth/master/guides/logstash/nginx/vhost/kibana4.conf -O /etc/nginx/sites-available/kibana.conf
Step 13: Open the kibana vhost file
$ sudo vi /etc/nginx/sites-available/kibana.conf
Step 14: Change the site name
Simply change the “logstash.ulyaoth.net” to whatever your logstash url will be and save the file.
Step 15: Symbolic link the vhost file so nginx will load it
$ sudo ln -s /etc/nginx/sites-available/kibana.conf /etc/nginx/sites-enabled/kibana.conf
Step 16: Go to the Logstash-Forwarder SSL directory
$ cd /opt/logstash-forwarder/ssl
Step 17: Create the SSL certificates that Logstash-Forwarder requires
$ sudo openssl req -x509 -subj '/CN=*.ulyaoth.net/' -nodes -newkey rsa:4096 -keyout logstash-forwarder.key -out logstash-forwarder.crt && chown logstash-forwarder:logstash-forwarder *
Make sure to change the command above to fit your domain name.
Step 18: Fix selinux
$ sudo semanage port -a -t http_port_t -p tcp 9200

$ sudo semanage port -a -t http_port_t -p tcp 5601
Step 19: Fix firewalld
$ firewall-cmd --permanent --zone=FedoraServer --add-service=http

$ firewall-cmd --permanent --zone=FedoraServer --add-service=https

$ firewall-cmd --permanent --zone=FedoraServer --add-port=5544/udp
Please be aware that the zone can depend on your setup or os version.
Step 20: Restart firewalld.
$ sudo systemctl restart firewalld.service
Step 21: Put Logstash, ElasticSearch, Nginx and Kibana on autostart.
$ sudo systemctl enable elasticsearch.service

$ sudo systemctl enable logstash.service

$ sudo systemctl enable logstash-forwarder.service

$ sudo systemctl enable nginx.service

$ sudo systemctl enable kibana.service
Step 22: Start the services in the order below ie “elasticsearch -> logstash -> logstash-forwarder -> nginx -> kibana”.
$ sudo systemctl start elasticsearch.service

$ sudo systemctl start logstash.service

$ sudo systemctl start logstash-forwarder.service

$ sudo systemctl start nginx.service

$ sudo systemctl start kibana.service
If you now go to your website for example for me “http://logstash.ulyaoth.net” you will see something like this:
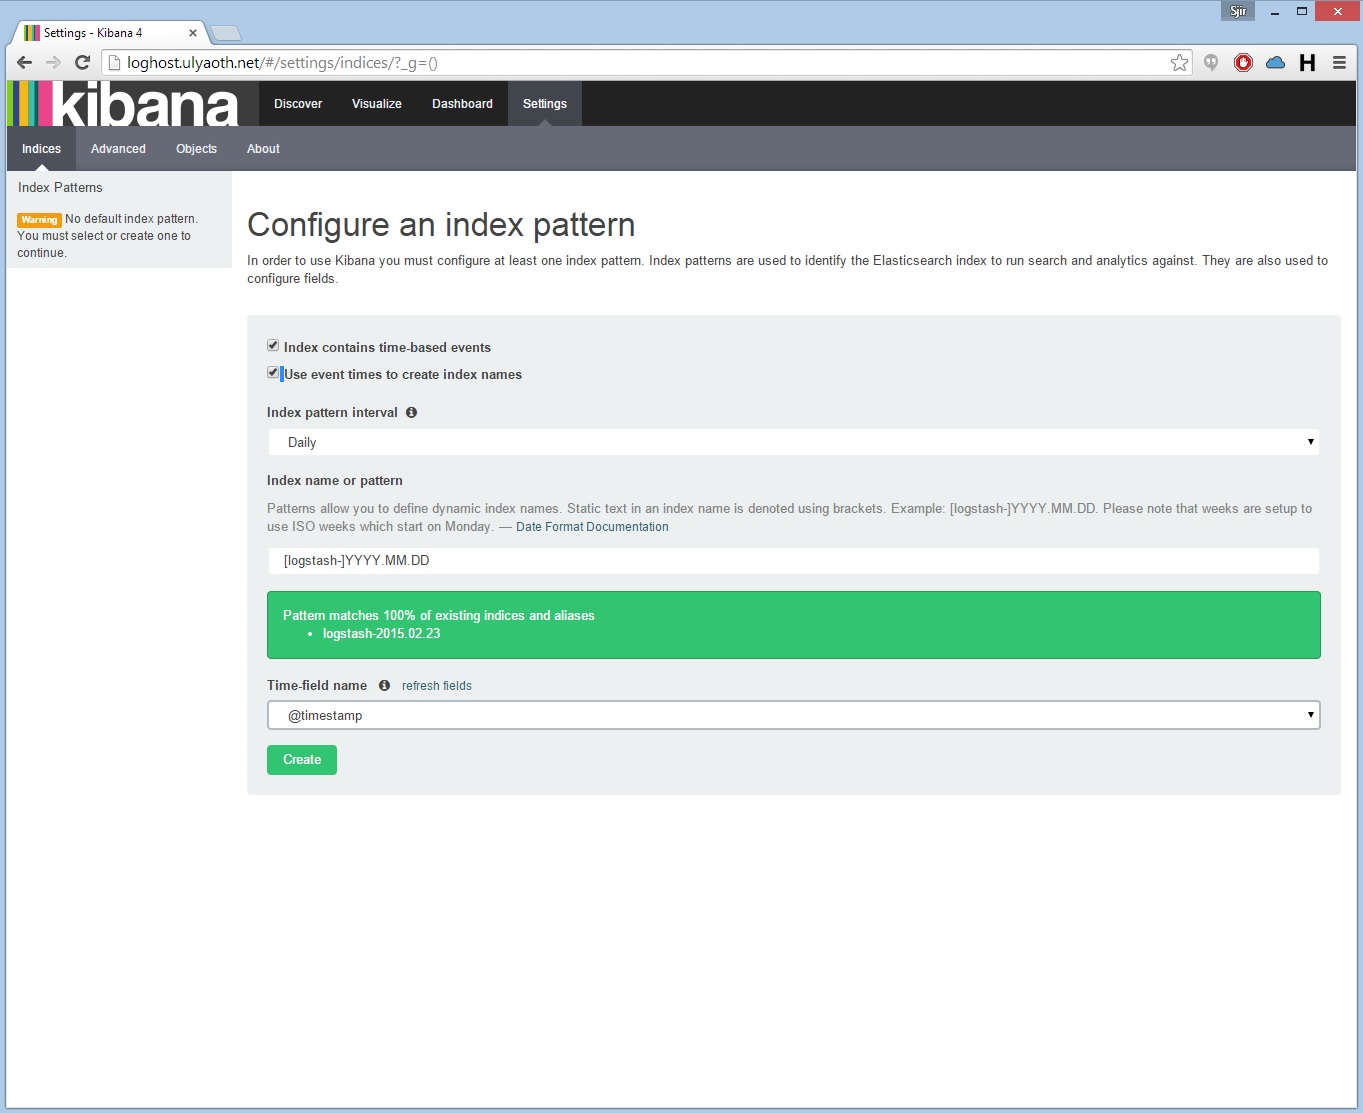
Make sure to choose the same options as I did above and then press on “Create” this will finish the Kibana configuration and you can start using it afterwards.
Logstash is a product that is always in development so the screenshot above is outdated probably by now as they keep changing the interface.
This is it everything should be working now 🙂 you should now be seeing something like this if you go to your Logstash website:
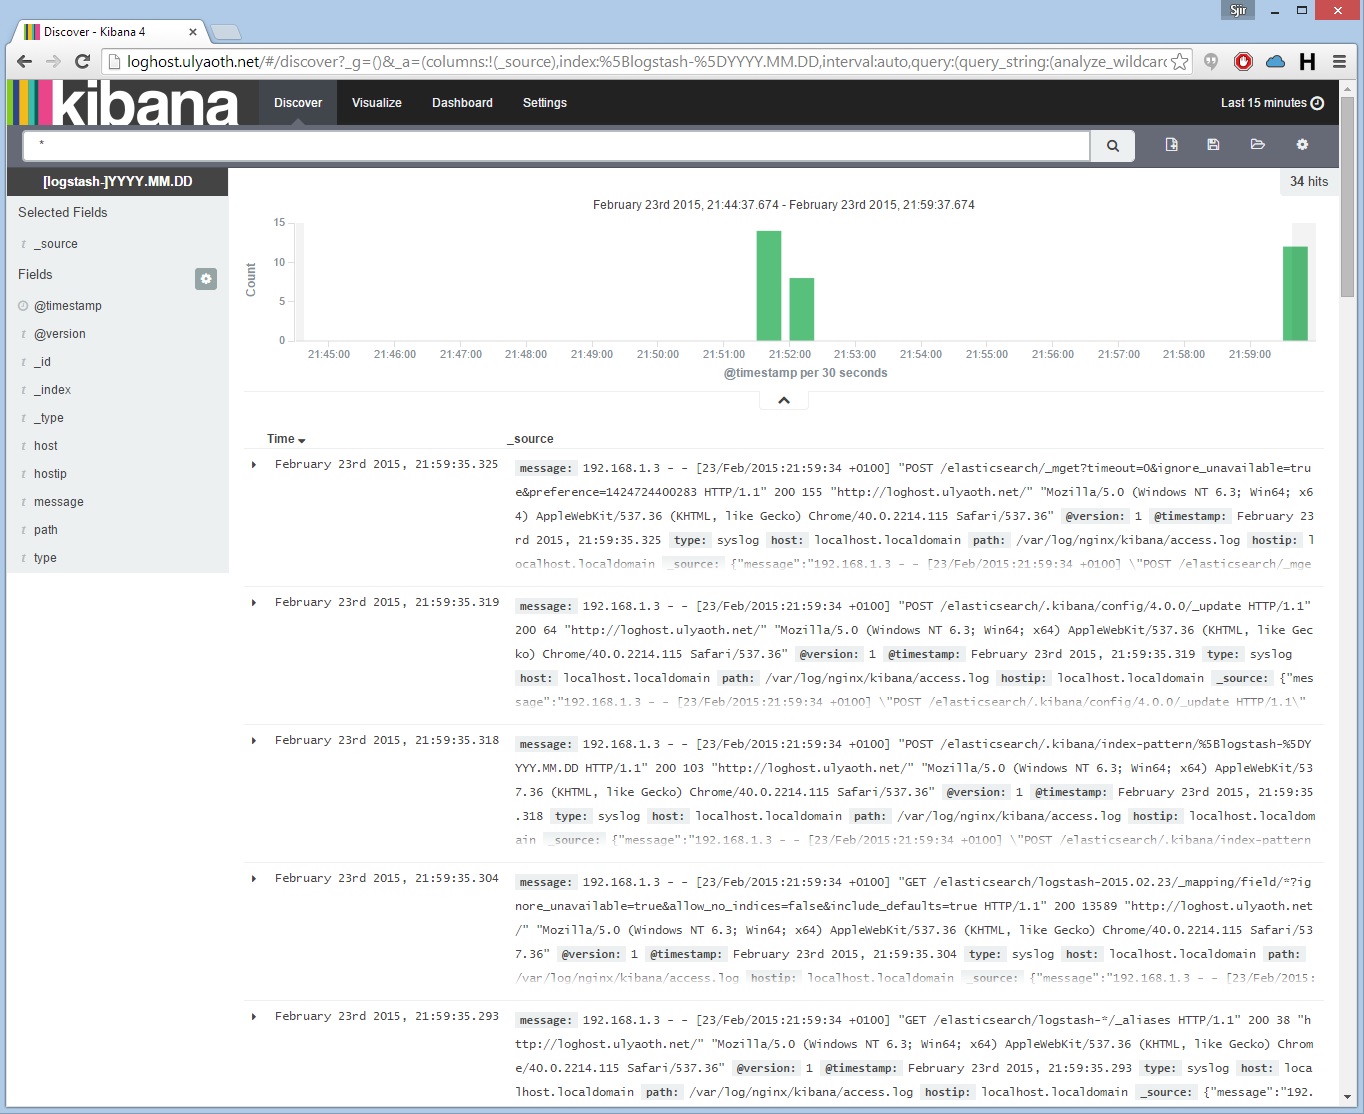
You probably question how come there are already logs, well this is because I added the following config already to the logstash-forwarder.conf.
{

"paths": [

"/var/log/nginx/*.log",

"/var/log/nginx/kibana/*.log"

],

"fields": { "type": "syslog" }

}
You can simply remove it or keep it.
You are now ready to edit the logstash-forwarder config to sent more logs and they should show up in Kibana! Congratulations!
If you want to ship logs from other servers all you have to do is install “ulyaoth-logstash-forwarder” on those servers and point the config to your logstash server.
Of-course I would suggest to read the full read-me of the logstash-forwarder at:
https://github.com/elasticsearch/logstash-forwarder
It does show you in more details how to create a proper and maybe better configuration as my example, but at-least I hope this guide shows how you can set everything up with a freshly installed server.
I hope this guide has helped you if you see any mistakes or have improvements please give me a reply and I will update the guide accordingly I am always happy to hear improvements.