
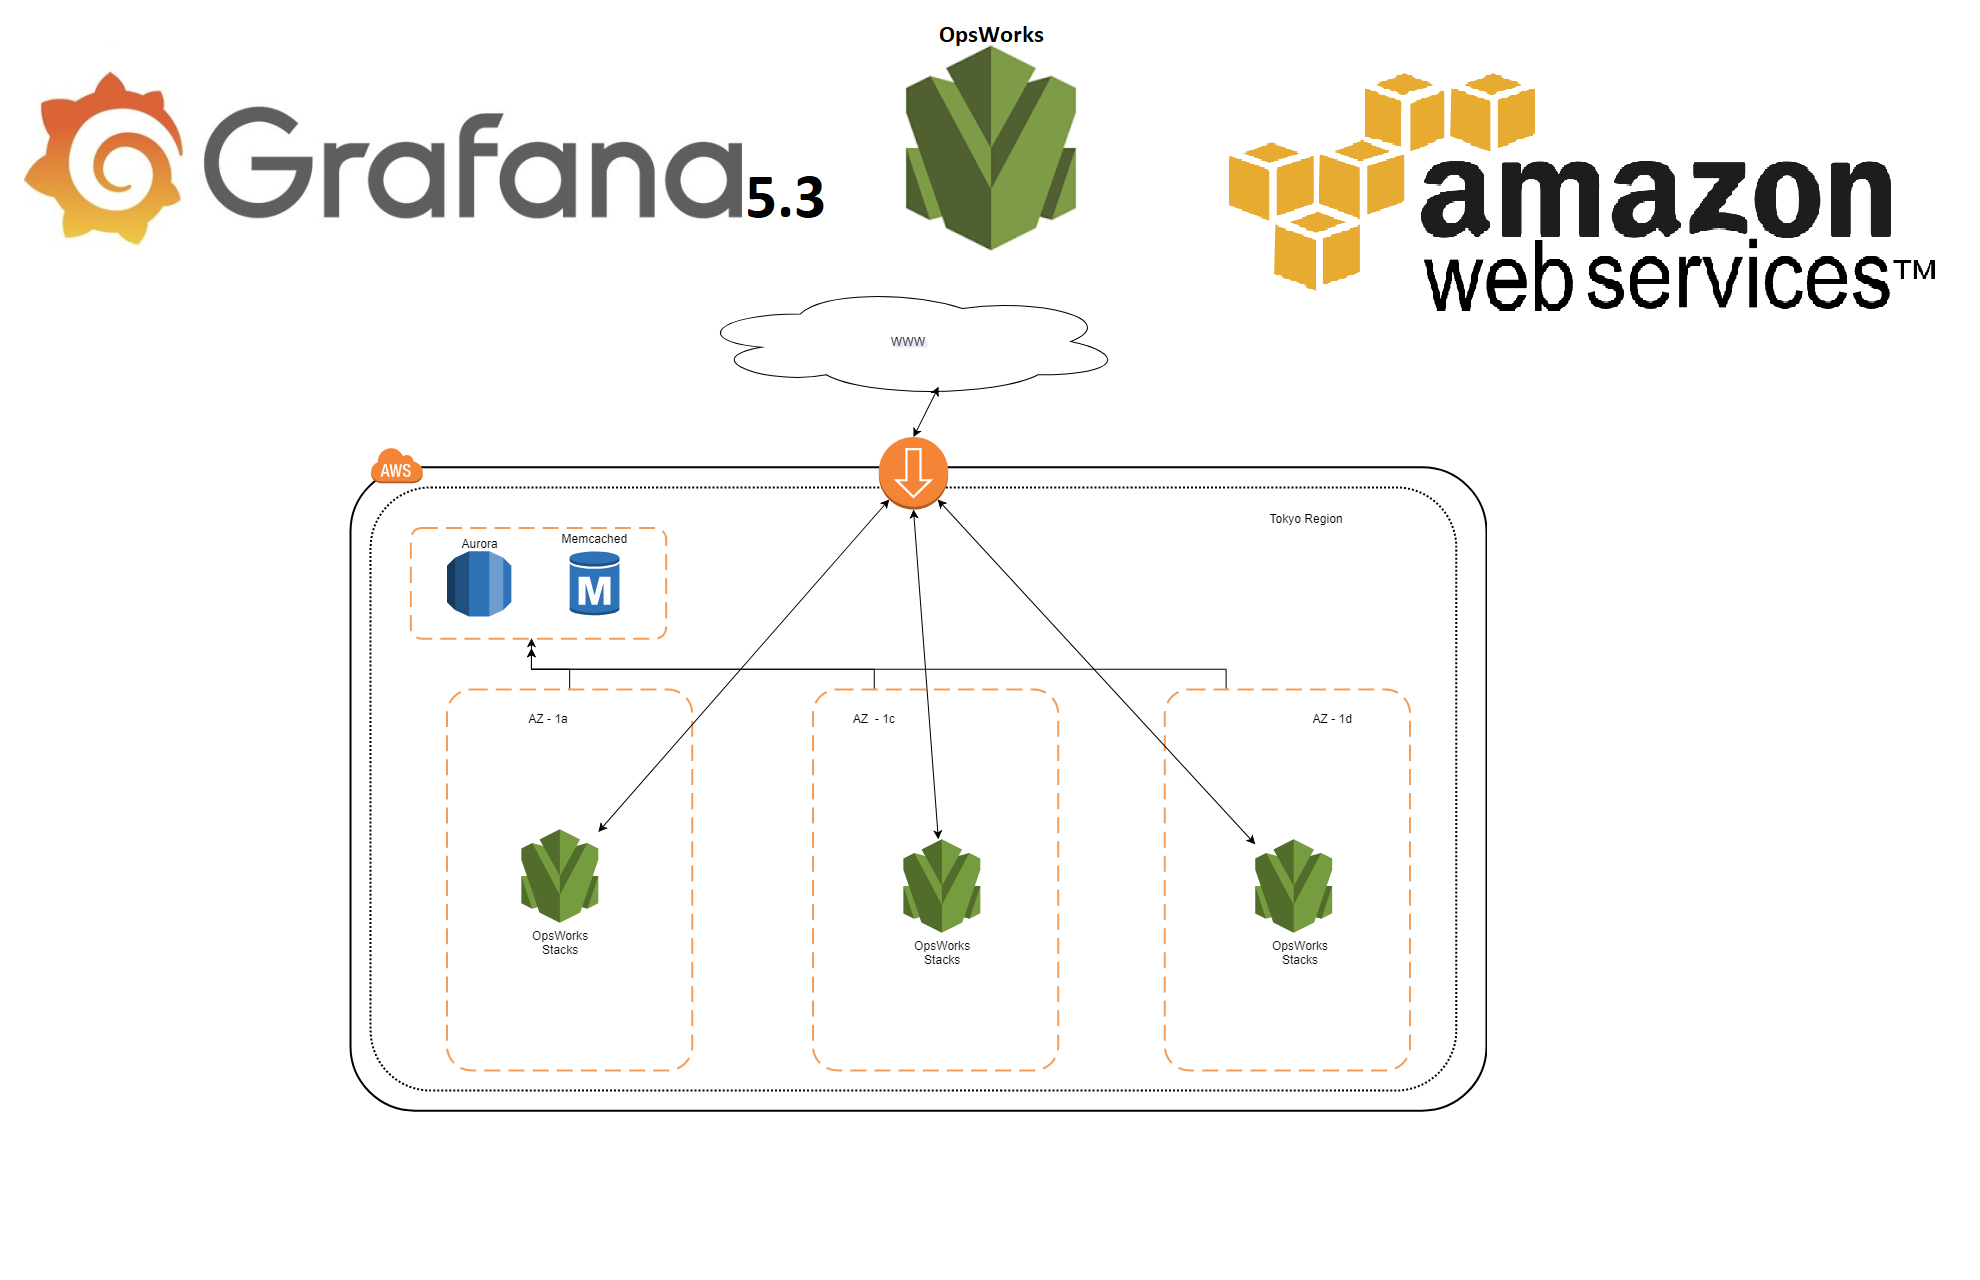
In this tutorial I will show you how to create manually a Grafana environment in AWS OpsWorks, the environment will contain 3 servers that are load balanced by an application load balancer.
Please for production usage see my comments at the end of this tutorial.
What will we create:
1x Key Pair
1x IAM Policy
1x IAM Role
4x Security Group
1x Github (https://github.com/ulyaoth/aws-opsworks-ha-grafana)
1x OpsWorks Stack
1x Memcached node
1x Aurora database
1x Application Loadbalancer
3x Grafana Server
Without further ado let’s get started!
Step 1: Create a AWS IAM Policy
In this step, we will create an AWS IAM Policy that we will connect to a role in step 2.
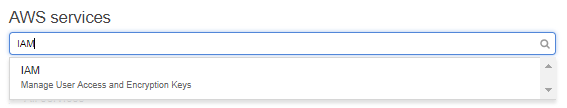
On the main aws page search for IAM and click on it.
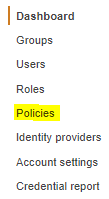
In the left menu click on the “Policies” option:
You should come to a page with many predefined policies from AWS, you can ignore all that and in the top click directly on the blue button called “Create policy” and you see:
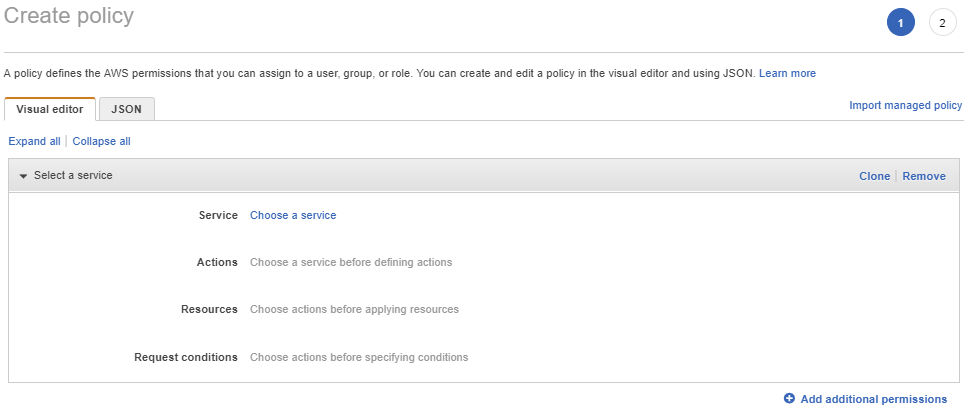
In the top click on the “JSON” button and then add the following JSON code, overwriting whatever it said currently:
{

"Version": "2012-10-17",

"Statement": [

{

"Effect": "Allow",

"Action": [

"elasticloadbalancing:RegisterTargets",

"elasticloadbalancing:DeregisterTargets",

"elasticloadbalancing:DescribeTargetHealth"

],

"Resource": "*"

}

]

}
It should look as following:
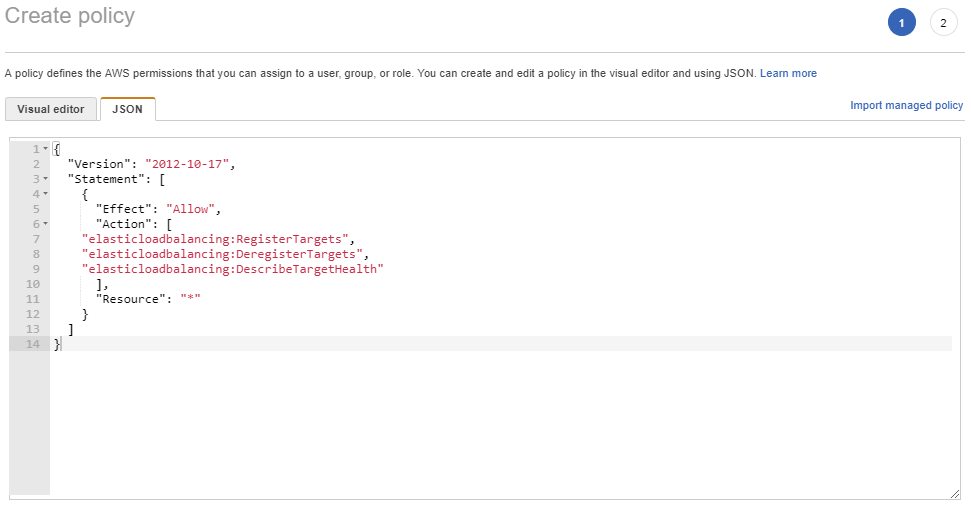
if all looks the same as the picture below then press on the “Review policy” button.
On this page fill in the following:
Name: aws-opsworks-ha-grafana-ec2-policy
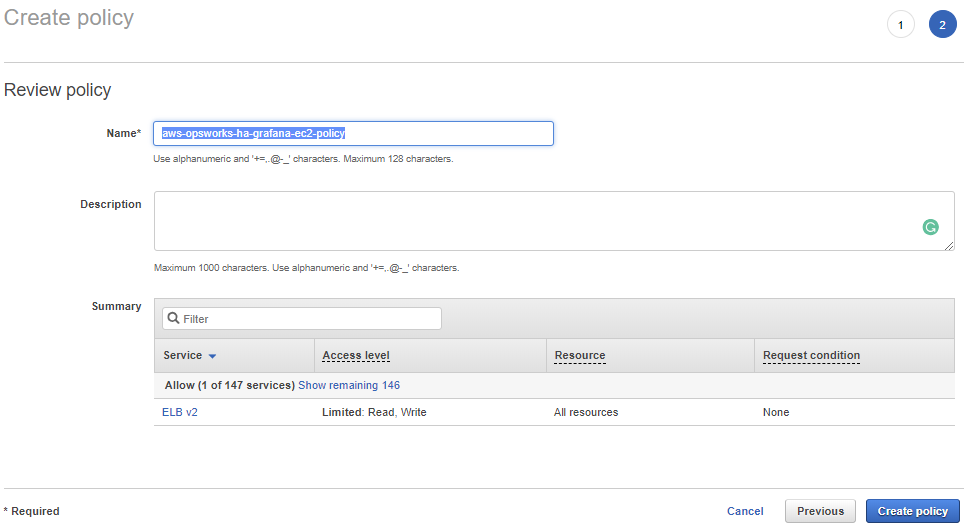
If it looks the same as the image then press on the “Create policy” button and you see.

Step 2: Create a AWS IAM Role
In this step we will create a IAM role and attach the policy we created in Step 1.
Now that you have created the policy click in the left menu on “Roles”.

On the page you see directly click on the blue button called “Create role” and you will see the following page:
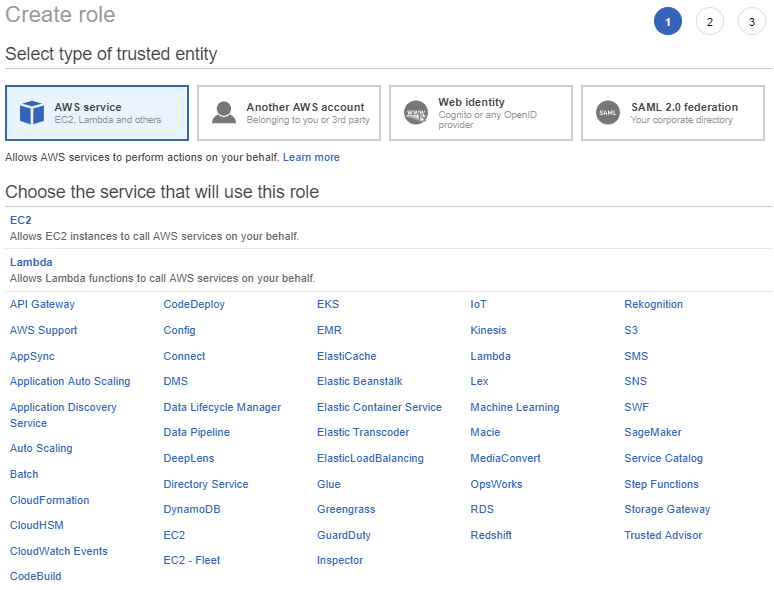
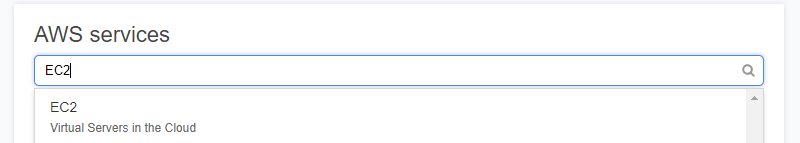
On this page choose the “EC2” option:

and then click on the blue button at the bottom called “Next: Permissions” and you will see the following:
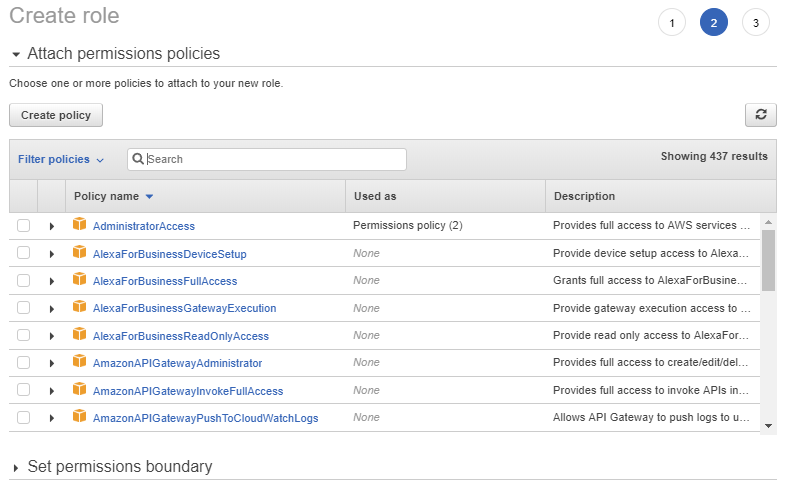
In the “Search” box search for the policy we created a few moments ago “aws-opsworks-ha-grafana-ec2-policy” and click the checkbox infront of it:

If it looks the same press on the “Next: Review” button at the bottom of the page and then fill it in as follows:
Name: aws-opsworks-ha-grafana-ec2-role
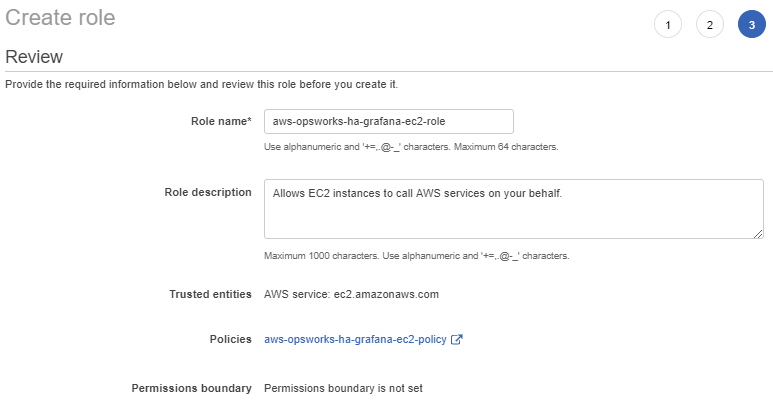
If all looks the same press on “Create role”.
Congratulations on creating the policy and role! And completing the first two steps.
Step 3: Create a key pair
In this step, we will create an EC2 Key Pair that is used to login to the servers with SSH, while we will not use it in this tutorial it is required by OpsWorks to have one.
Start by going back to the main AWS page you can do this by clicking the AWS logo in the top and then search for EC2 and click on it:
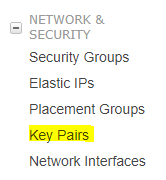
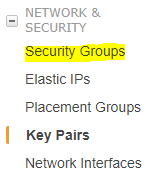
and from the new page in the left menu under Network & Security choose the option “Key Pair” (highlighted in yellow):
Now click the blue button “Create Key Pair” and you should see a box like this appear:

Fill in the following:
Key pair name: aws-opsworks-ha-grafana-key
And press on the blue “Create” button and you should see something like this now:
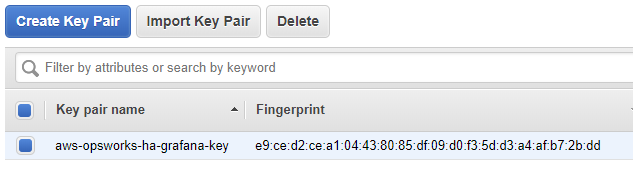
That is it for the creating the key pair good job!
Step 4: Create a four security groups
In this step, we will create the four required security groups one for the load balancer, one for the servers, one for the session cache and the final one is for the database.
So from the page where you created the key pair in the previous step we now choose the “Security Groups” option in the left menu this is again under Network & Security (highlighted in yellow):
And on the new page in the top press the blue button that is called “Create Security Group”.
You will now see the following box:
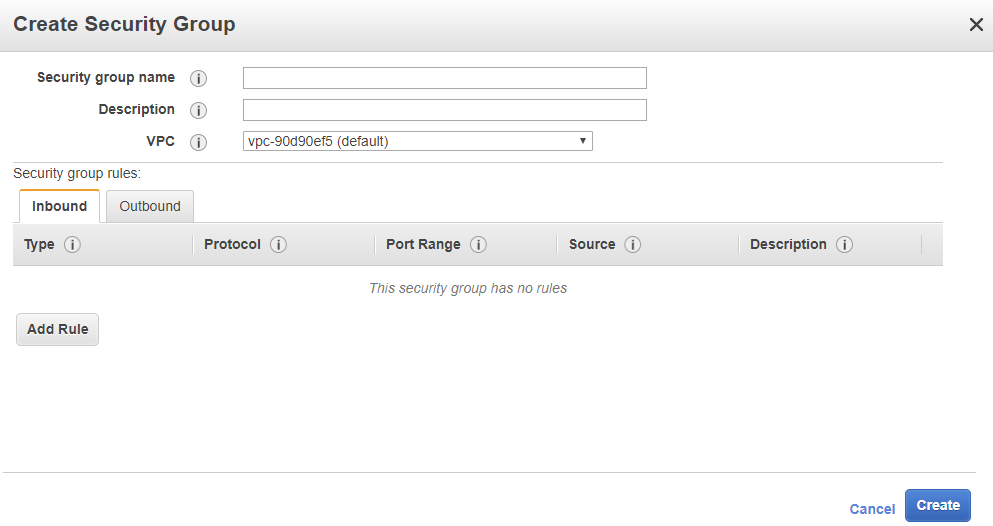
You will fill in the fields as follows:
Load balancer:
Security group name: aws-opsworks-ha-grafana-alb
Description: Security Group for HA Grafana Application Loadbalancer
VPC: (leave this as it is we will use the default vpc)
Security Group rules:
Inbound:
Type: HTTPS
Protocol: TCP
Port Range: 443
Source: My IP (I recommend you choose “Custom” and fill in a ip-range)
Description: Allow HTTPS traffic into the Loadbalancer
It should now look like this:

If it looks similar then press on the blue “Create” button.
Now you should see in your window something similar like this:
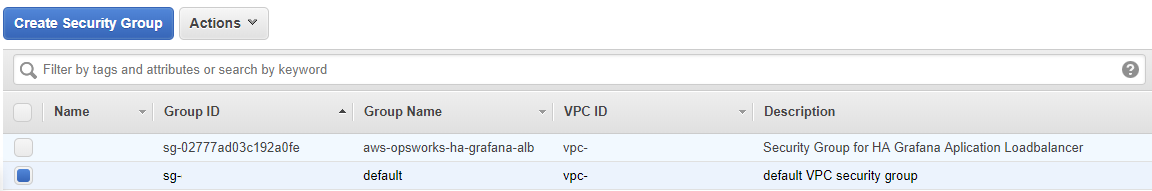
Now the important bit of this picture is that it shows you that every security group you create gets a unique “Group ID” this is important because in the following groups we have to use the Group ID of other security groups to open up connections between them.
So if I write (your aws-opsworks-ha-grafana-alb Group ID) I mean in my case I should write “sg-02777ad03c192a0fe“.
We will now repeat the same we did above three more times, so for each security group below press the blue button “Create Security Group” and fill it in as below.
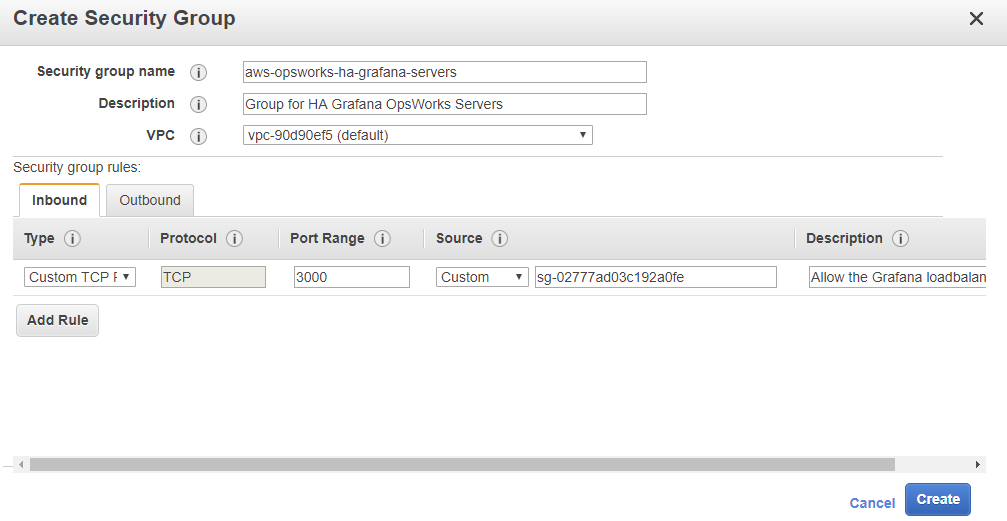
OpsWorks Servers:
Security group name: aws-opsworks-ha-grafana-opsworks-servers
Description: Security Group for HA Grafana OpsWorks Servers
VPC: (leave this as it is we will use the default vpc)
Security Group rules:
Inbound:
Type: Custom TCP Rule
Protocol: TCP
Port Range: 3000
Source: Custom (your aws-opsworks-ha-grafana-alb Group ID)
Description: Allow the Grafana loadbalancer to access port 3000.
It should look like this:
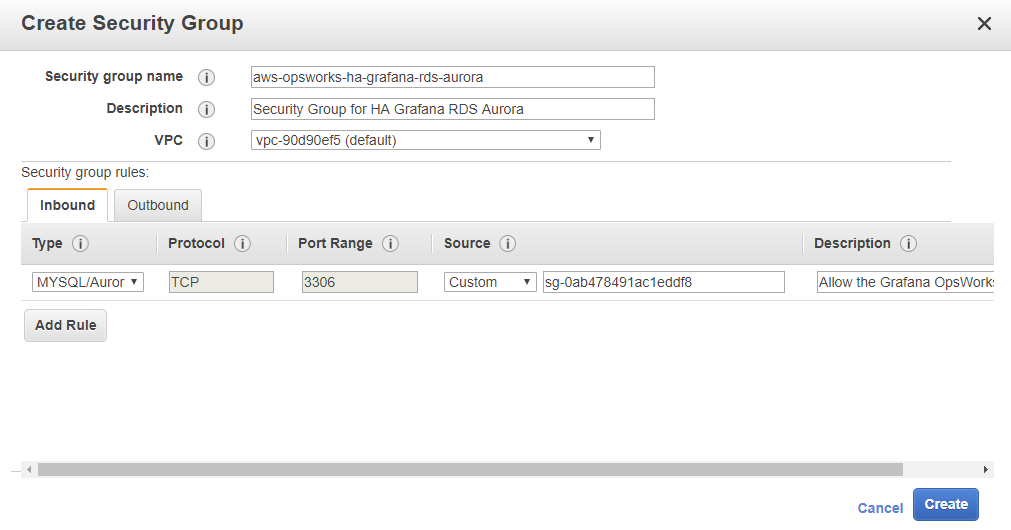
RDS Aurora Database:
Security group name: aws-opsworks-ha-grafana-rds-aurora
Description: Security Group for HA Grafana RDS Aurora
VPC: (leave this as it is we will use the default vpc)
Security Group rules:
Inbound:
Type: MYSQL/Aurora
Protocol: TCP
Port Range: 3306
Source: Custom (your aws-opsworks-ha-grafana-opsworks-servers Group ID)
Description: Allow the Grafana OpsWorks Servers to access the database.
It should look like this:
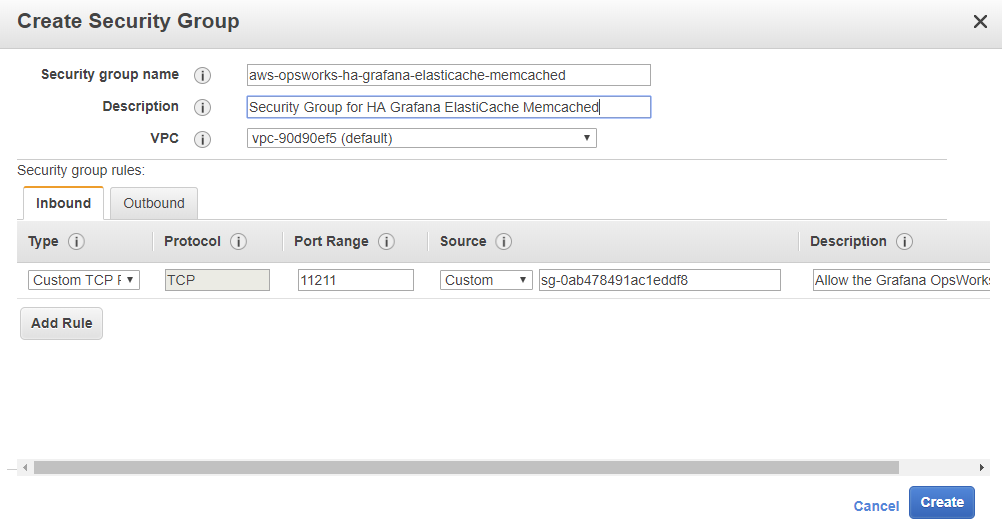
ElastiCache Memcached:
Security group name: aws-opsworks-ha-grafana-elasticache-memcached
Description: Security Group for HA Grafana ElastiCache Memcached
VPC: (leave this as it is we will use the default vpc)
Security Group rules:
Inbound:
Type: Custom TCP Rule
Protocol: TCP
Port Range: 11211
Source: Custom (your aws-opsworks-ha-grafana-opsworks-servers Group ID)
Description: Allow the Grafana OpsWorks Servers to access the memcached cluster.
It should look like this:
If you did everything correct you should now have 4 security groups and your page should look similar like this:
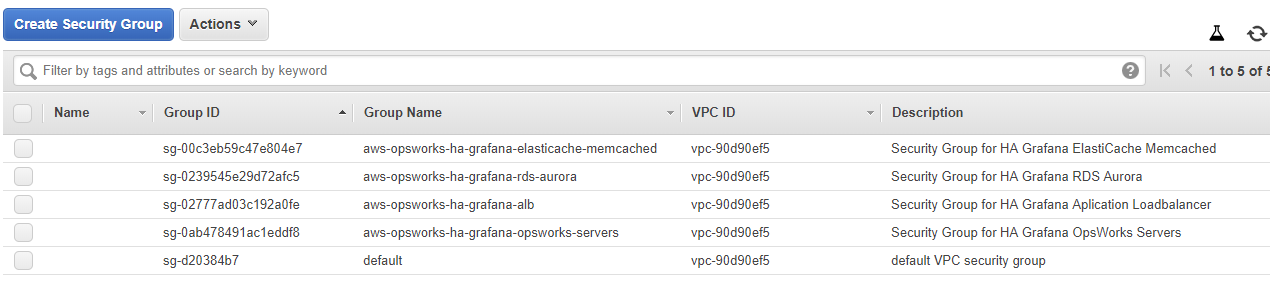
Congratulations you now have created all the required security groups.
Step 5: Create the Load Balancer
In this step, we are going to create the load balancer that will make sure you can reach your three servers so you have high availability.
From security groups page click in the left menu on the “Load Balancing” menu and click on “Load Balancers”.

And on the new page in the top click on the blue button called “Create Load Balancer” and you will see:
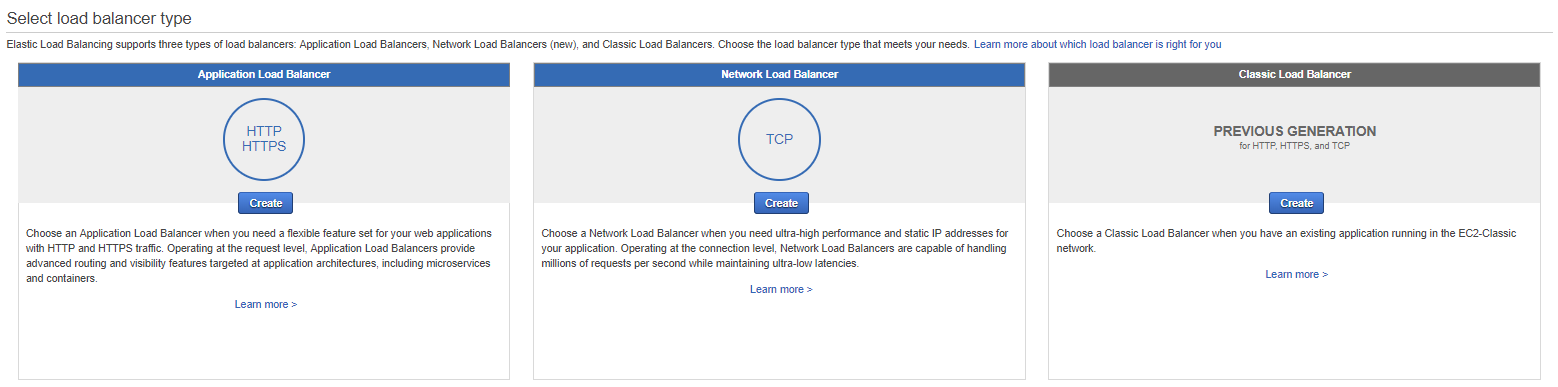
For this tutorial, we will use the first box the “Application Load Balancer” so in the fist box you can click on the blue “Create” button.
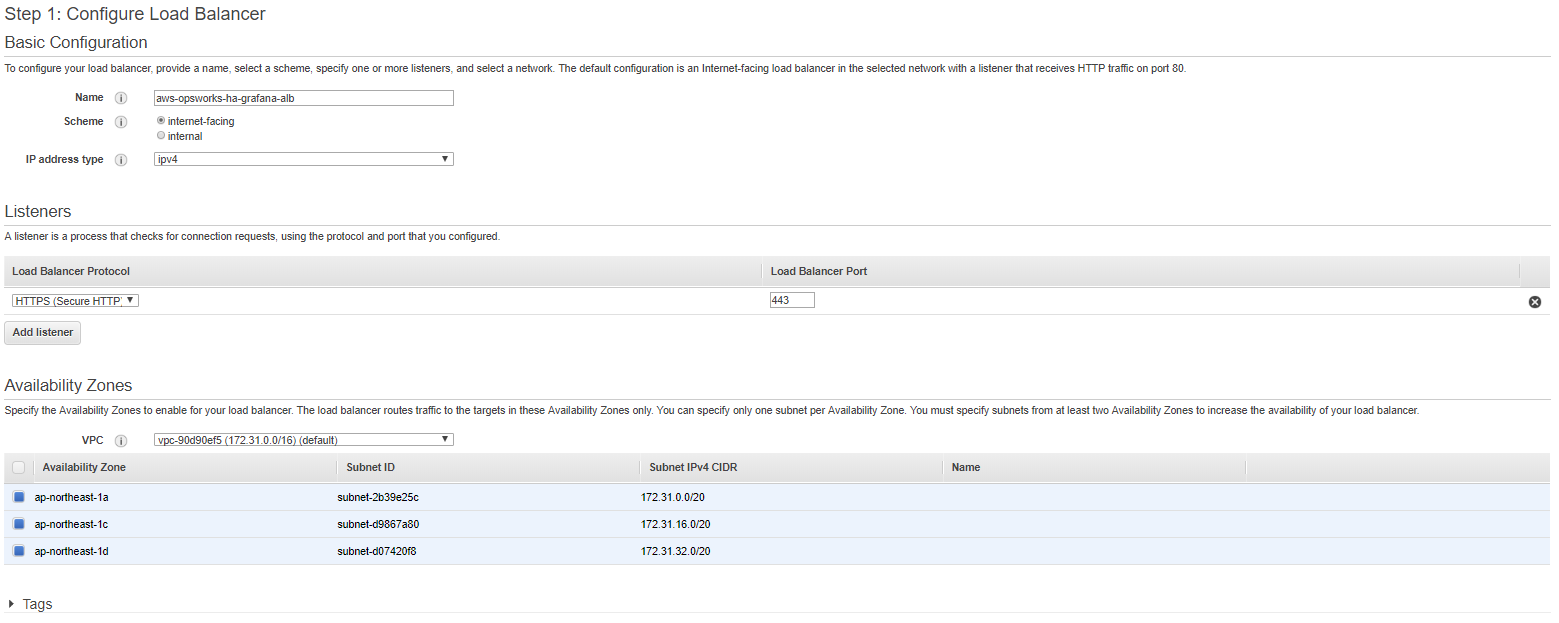
The new page you will see you must fill in as follows:
Name: aws-opsworks-ha-grafana-alb
Scheme: internet-facing
IP address type: ipv4
Load Balancer Protocol: HTTPS
Load Balancer Port: 443
Availability zone: (depends on your region) I am making this guide in the Tokyo regio so I choose: 1a, 1c, 1d
When it looks the same press at the right bottom on the button “Next: Configure Security Settings” and you will see:
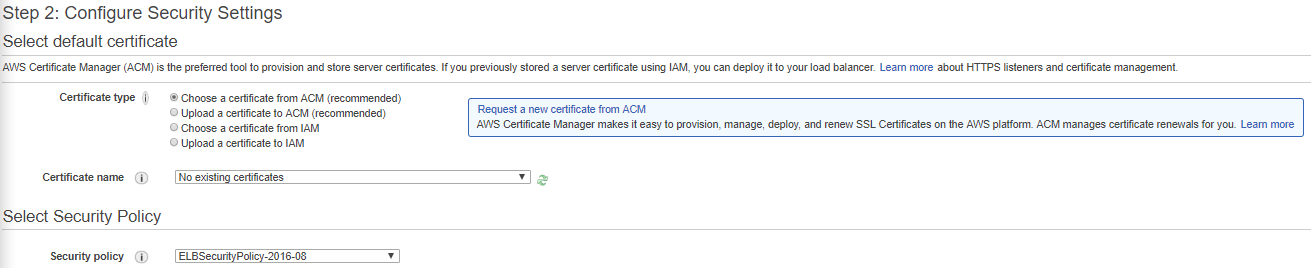
Now here you need to upload your certificate or create one in ACM this depends on your situation.
For this tutorial I will create a new certificate so I will press the “Request a new certificate from ACM”:

I will come to a page and there I will choose the domain I want use for my Grafana environment, in our case we choose: grafana-tutorial.ulyaoth.com. (Please make sure to choose your own domain name)

And then press on the blue “Next” button and you will see a page like this:
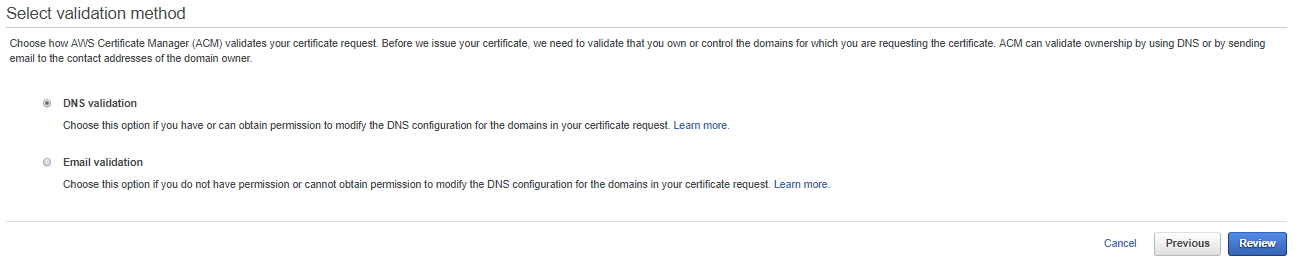
On this page, you must choose a validation method for your domain I will use “Email validation” for this tutorial.
So select that if you can also and then press on the blue button called “Review”.
You will now see a page with the details you filled in:
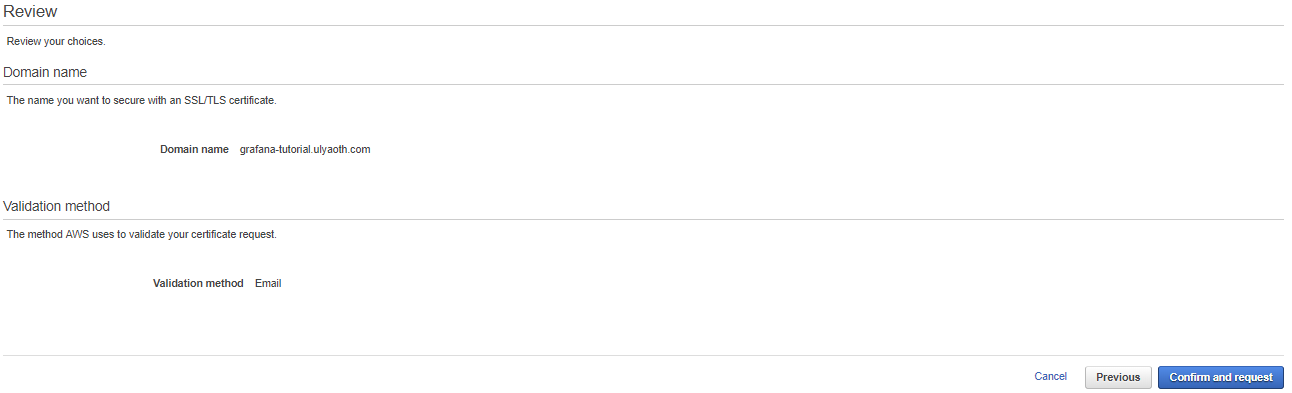
If it all looks good then press on the blue button named “Confirm and request” you will see:
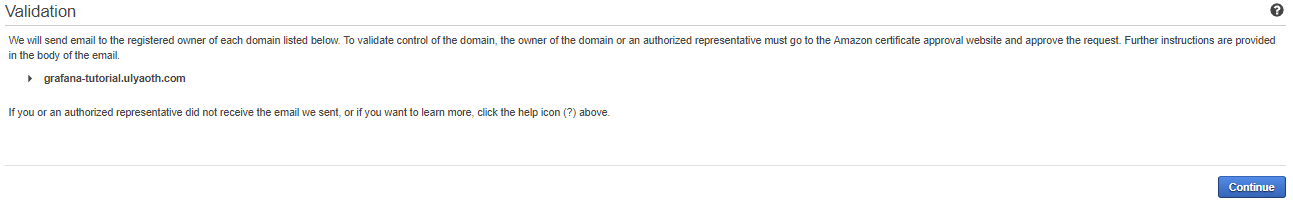
You can just press the blue button called “Continue”.
Now if everything goes well you will receive an email from Amazon with a link you must click to verify your domain it will look like this:
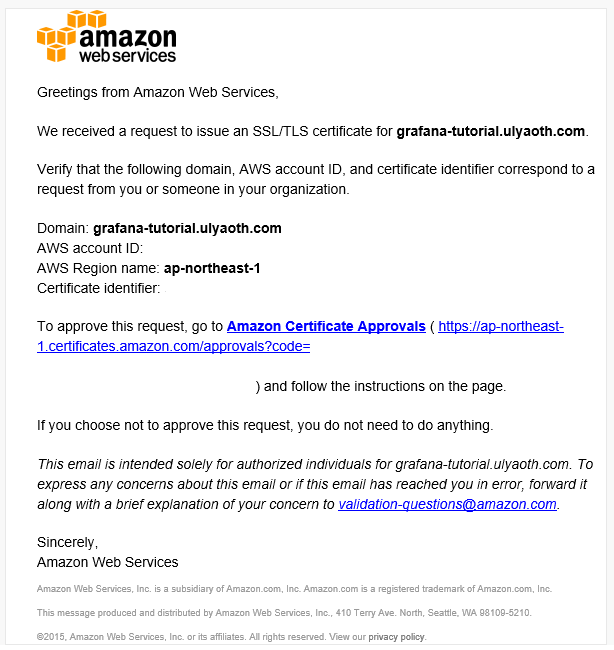
Double check once more that it all looks fine and then press the link to confirm the certificate, this will open the following page that basically almost shows the same as the email:
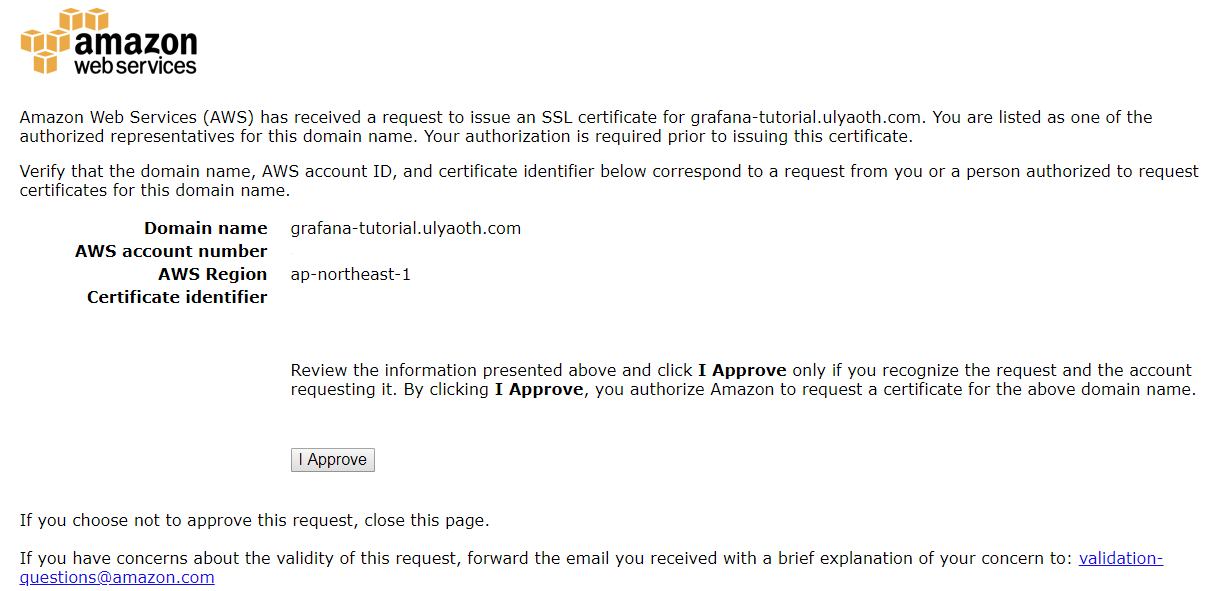
Again if it looks good click on the “I Approve” button and you see a page if it was successful:
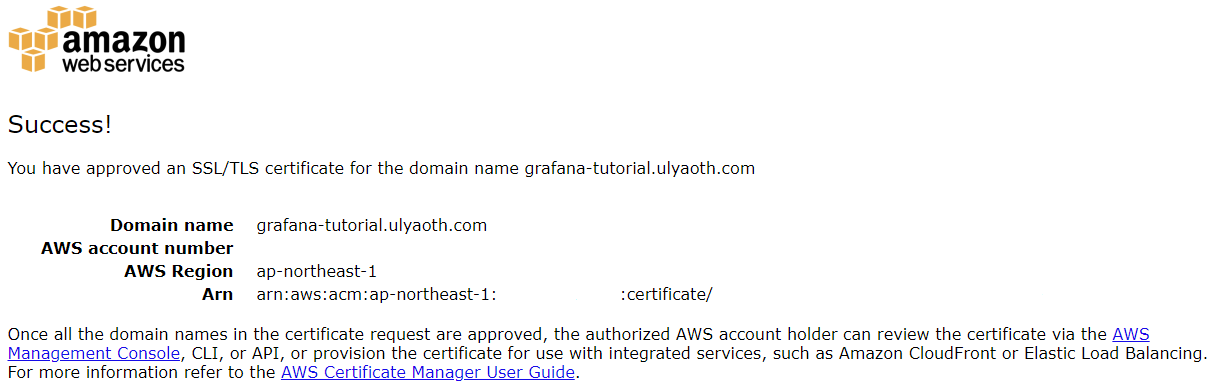
Now close the additional tabs that got opened so you come back to the load balancer page.
Back at the loadbalancer page now fill it in as follows:
Certificate type: Choose a certificate from ACM
Certificate name: grafana-tutorial.ulyaoth.com
Security policy: ELBSecurityPolicy-TLS-1-2-Ext-2018-06

Now press the button in the bottom of the page called “Next: Configure Security Groups”
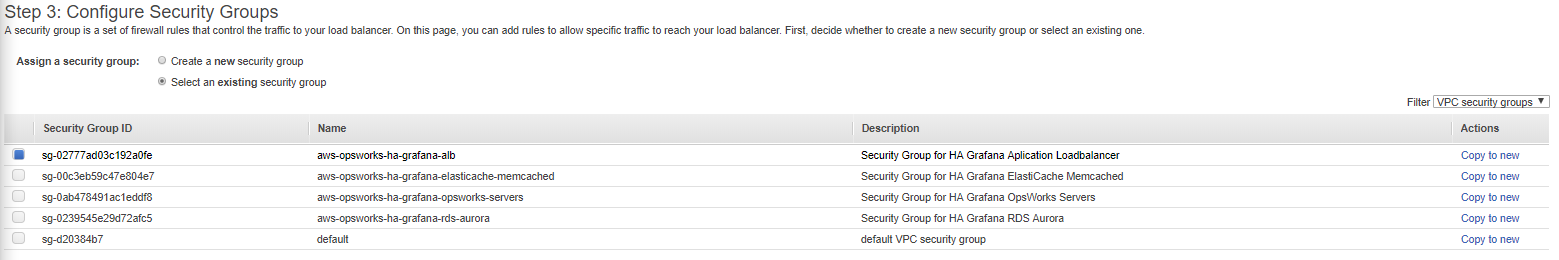
Here you choose the security group we created in Step 4, choose the “aws-opsworks-ha-grafana-alb” security group and press the button: “Next: Configure Routing”
On the configure routing page you must fill in everything as follows:
Name: grafana
Protocol: HTTP
Port: 3000
Target type: instance
Protocol: HTTP
Path: /api/health

What you did here is telling the load balancer that Grafana will run on port 3000 and the load balancer can check the url “/api/health” to see if Grafana is up and running.
Let continue by pressing on the button “Next: Register Targets”, and then you basically do nothing on the register target page you will leave everything blank.
So again choose nothing and just press the button at the bottom of the page called “Next: Review”.
You will see a review page that looks like this:
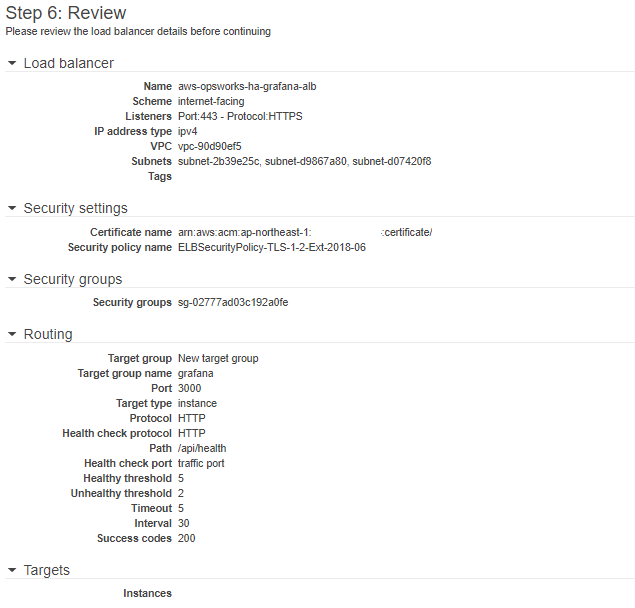
You can press on the blue “Create” button and if everything is successful you will see:
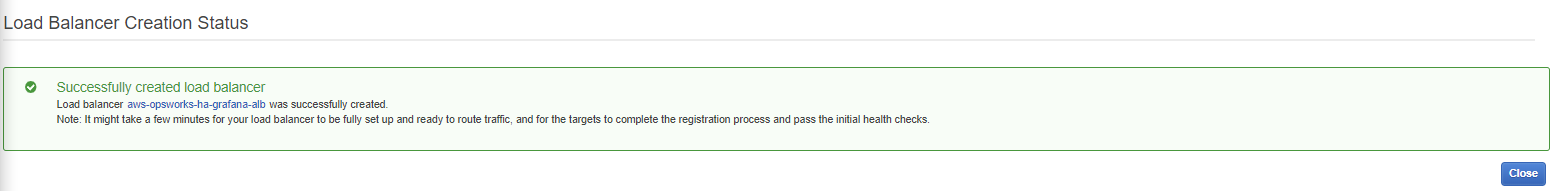
Congratulations you created your load balancer!
You can press now the “Close” button and then you will see your load balancer page, take note of the DNS name for me this is:
aws-opsworks-ha-grafana-alb-1189858783.ap-northeast-1.elb.amazonaws.com
So I will have to create a CNAME at my dns provider:
grafana-tutorial.ulyaoth.com = aws-opsworks-ha-grafana-alb-1189858783.ap-northeast-1.elb.amazonaws.com
You must create this CNAME also for the domain you have chosen in order to browse Grafana at the end of this tutorial.
Now there is one more thing we need to write down and that is the ARN of the target group we created during the load balancer creation steps.
In the left menu click on “Target Groups”:

You should now see a page like this and you should copy the “ARN” that I marked yellow. if you have multiple target groups you must click the target group we named “grafana”.
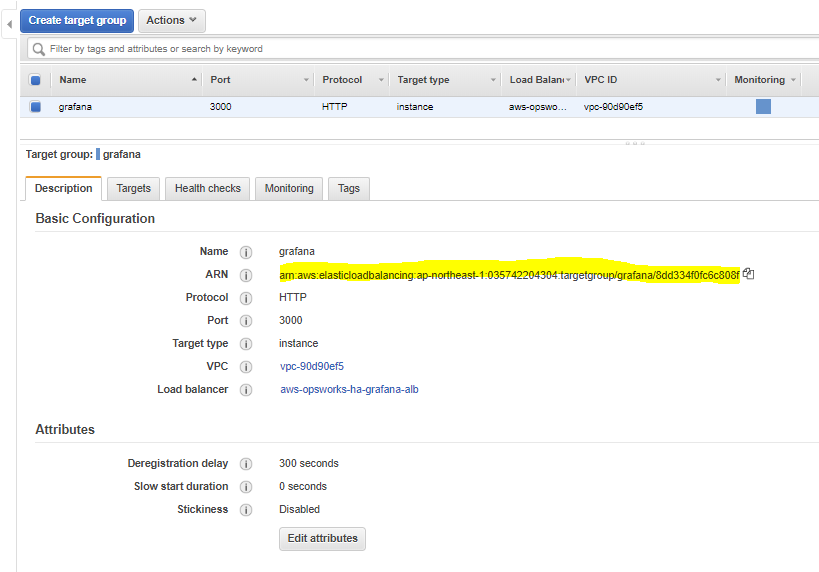
so as you can see my ARN is:
arn:aws:elasticloadbalancing:ap-northeast-1:035742204304:targetgroup/grafana/8dd334f0fc6c808f
Just write it down we need it later in this tutorial.
Now let’s create the Aurora database, this will hold your dashboards and user settings.
Step 6: Create the database
In this step we will create a database, in order for Grafana to run in a high availability environment, you have to save your Grafana information into a centralized database that all server can access.
If you would not do this then if you create a Dashboard on server one and you are load-balanced to server 2, you will not see that dashboard on server 2.
Go back to the main AWS page by clicking on the AWS logo in the top and now search for RDS and click it.
On the new screen press the orange button called “Launch database instance” and you should see the following:
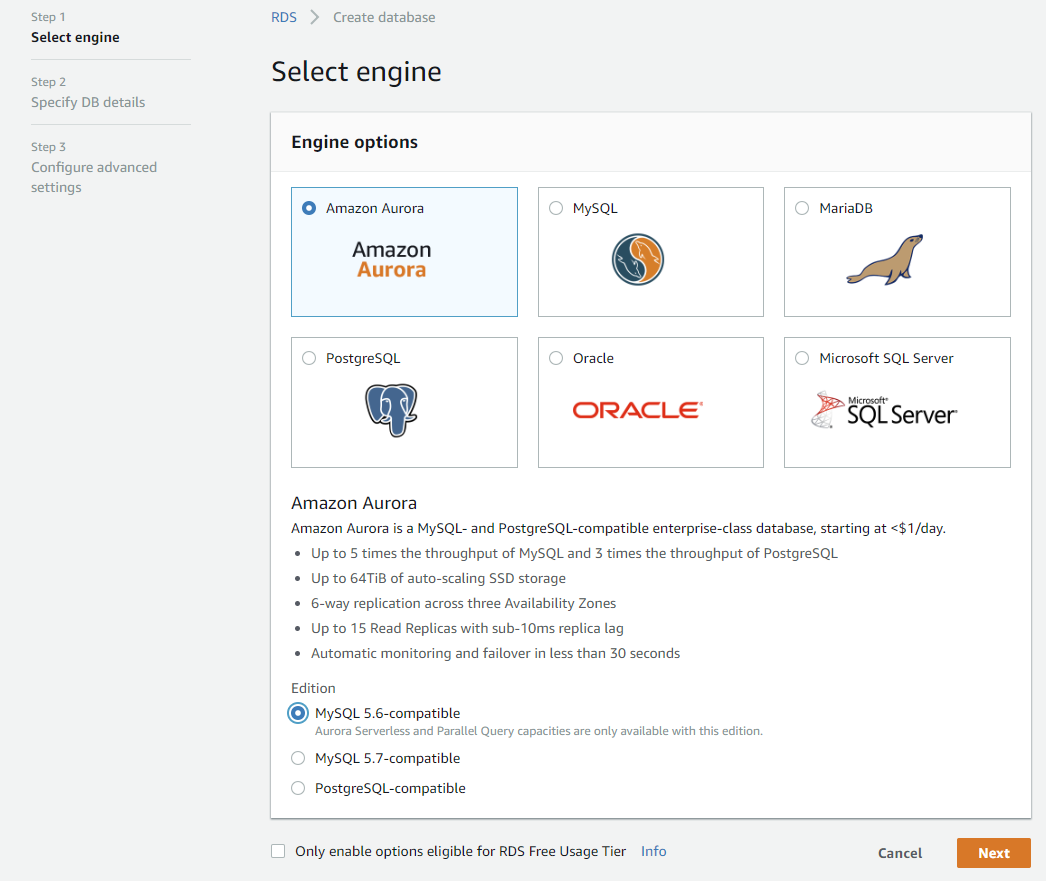
You could also use MySQL, PostgreSQL also but to keep it an AWS related guide I will use Amazon’s database called Aurora.
Aurora should already be selected by default as you see on the above picture so all you have to do is press the orange “Next” button.
On the next page fill everything in as you see below:
Capacity Type: db.t2.small
Multi-AZ: Create Replica in Different Zone
DB instance identifier: ulyaoth-tutorials (choose your own)
Master Username: ulyaoth (choose your own)
Master Password: FmKj!gW^a^2h$xbcdCY$7sGPo8U5Sp7SIXkYLnH (choose your own)
It should look as following:
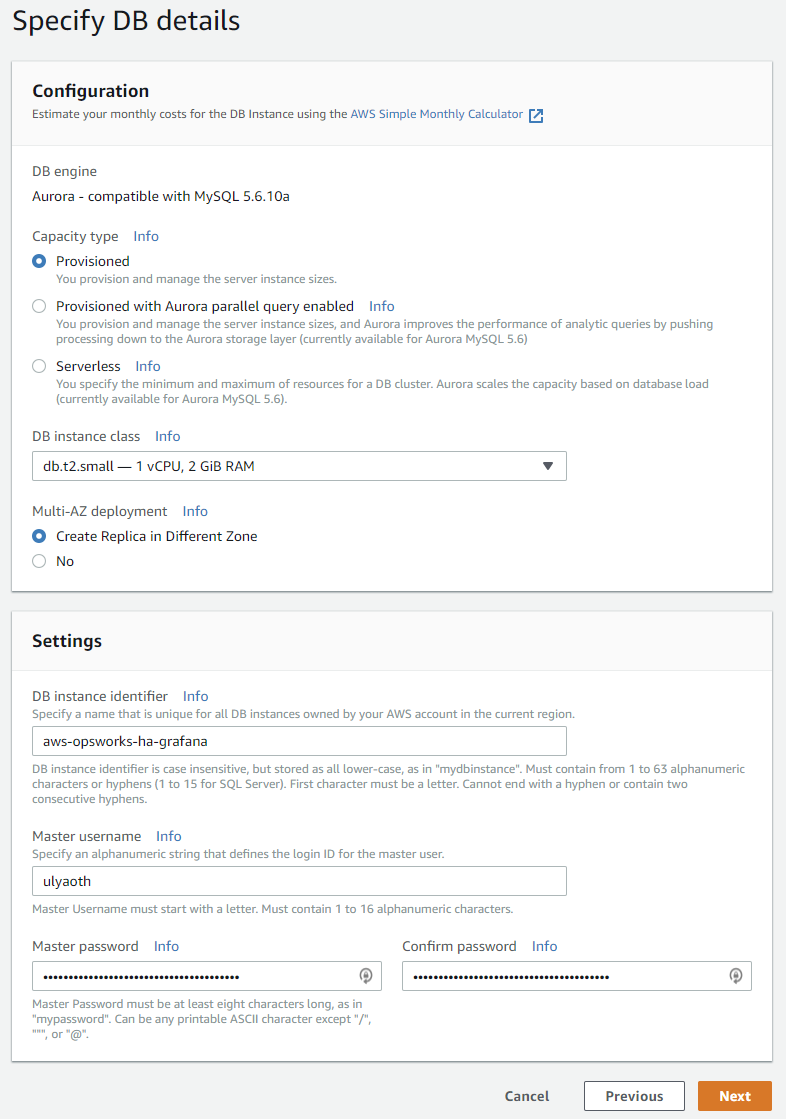
If it all does then press on the Orange “Next” button.
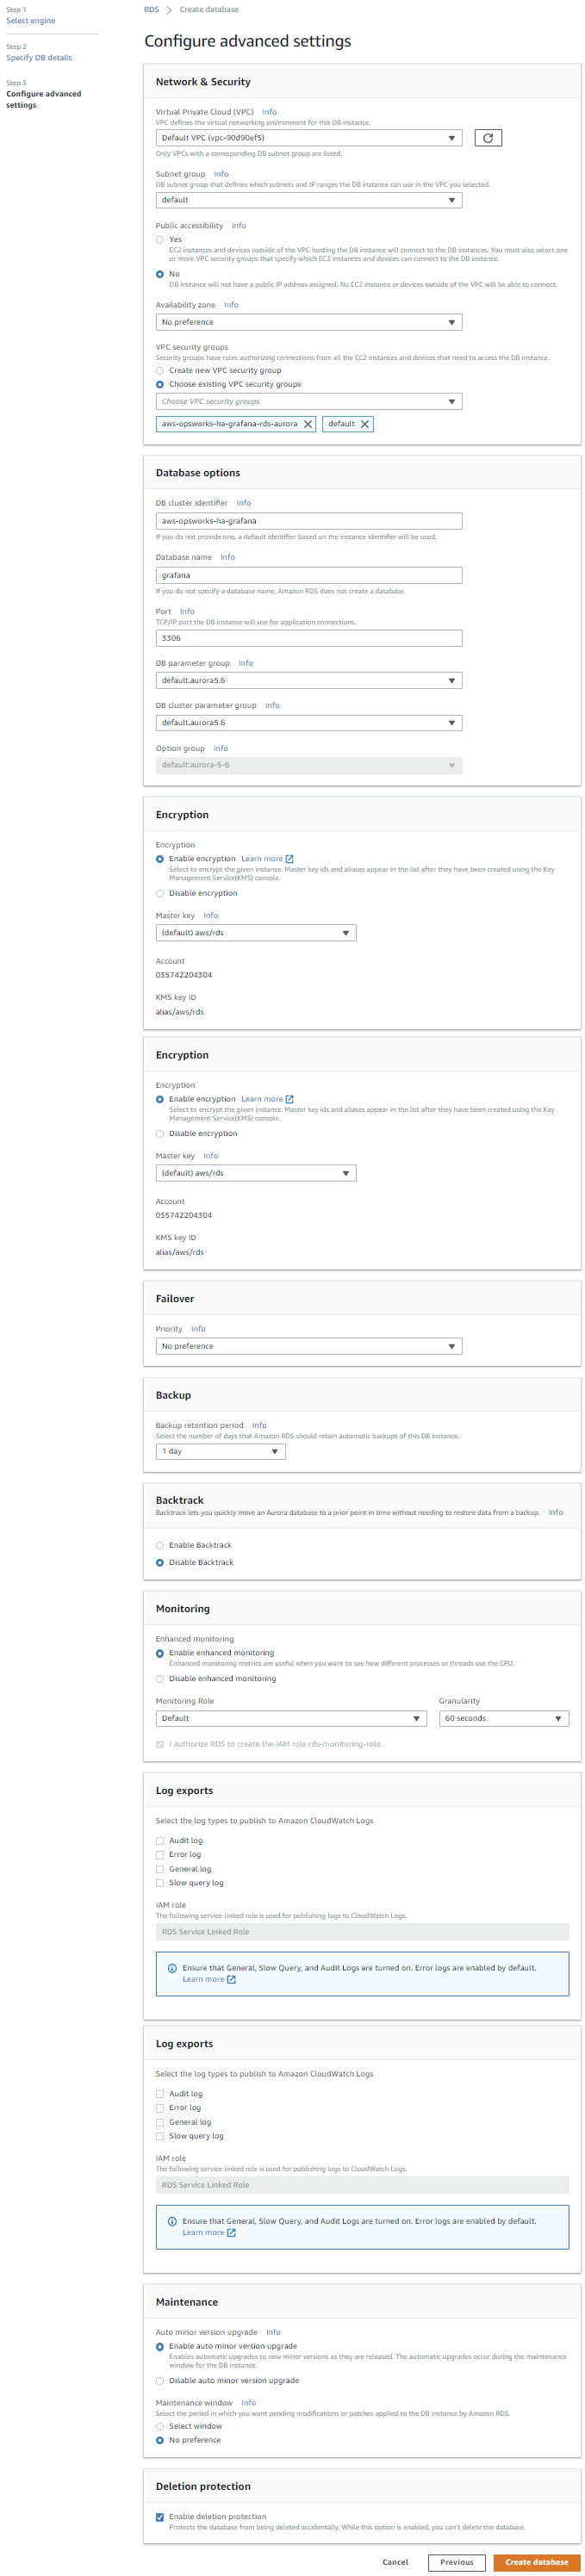
On the next page fill everything in as bellow:
Virtual Private Cloud (VPC): (leave as it is)
Subnet group: (leave as it is)
Public accessibility: No
Availability Zone: No preference
VPC Security Groups: Choose existing VPC security groups (choose: aws-opsworks-ha-grafana-rds-aurora)
DB cluster identifier: aws-opsworks-ha-grafana
Database name: grafana
Port: 3306
DB parameter group: (leave as it is)
DB cluster parameter group: (leave as it is)
Option Group: (leave as it is)
Encryption: (leave as it is)
Failover: (leave as it is)
Backup: (leave as it is)
Backtrack: (leave as it is)
Monitoring: (leave as it is)
Log Exports: (leave as it is)
Maintenance: (leave as it is)
Deletion protection: (leave as it is)
It should look like this: (click on image to enlarge)
If you did this then go forward and press the orange button once more and you should see it is creating your database:
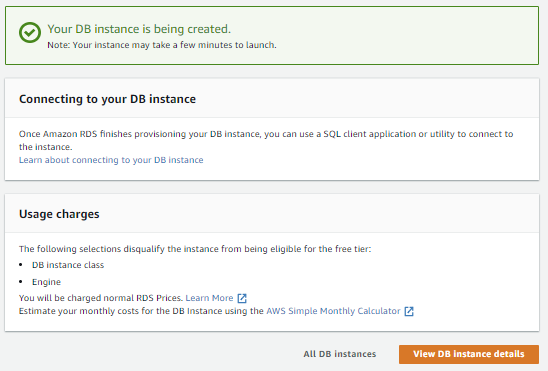
Now I have left very much just default if you would create an Aurora database for production use you would more carefully look at the options available, you also would probably place it in its own subnet etc.
Now press on the “View DB instance details” button, it could be that you need to wait for sometime so Aurora can create the database.
Once it is finished creating you will see under “connect” you endpoint name take note of this so for example for me it is:
Endpoint: ulyaoth-tutorials.cmjvdb4zv5m3.ap-northeast-1.rds.amazonaws.com
This is basically the address that Grafana will use to connect to your database so write it somewhere down we need it later.
Step 7: Create the a session cache
In this step, we will create a Memcached instance you use this to store the sessions of your Grafana user, else every time the load balancer puts them on a different server they have to log in again and lose what they were doing.
Start by going back to your main AWS page again by pressing the AWS logo in the top of the website.
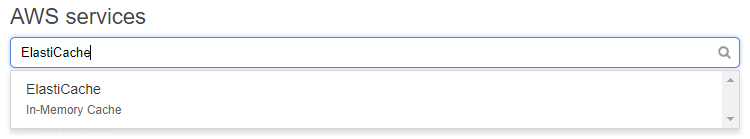
Now search for ElastiCache and choose this.
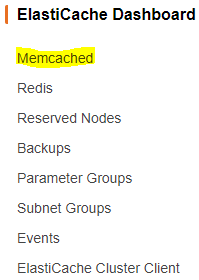
In the left menu click on “Memcached”:
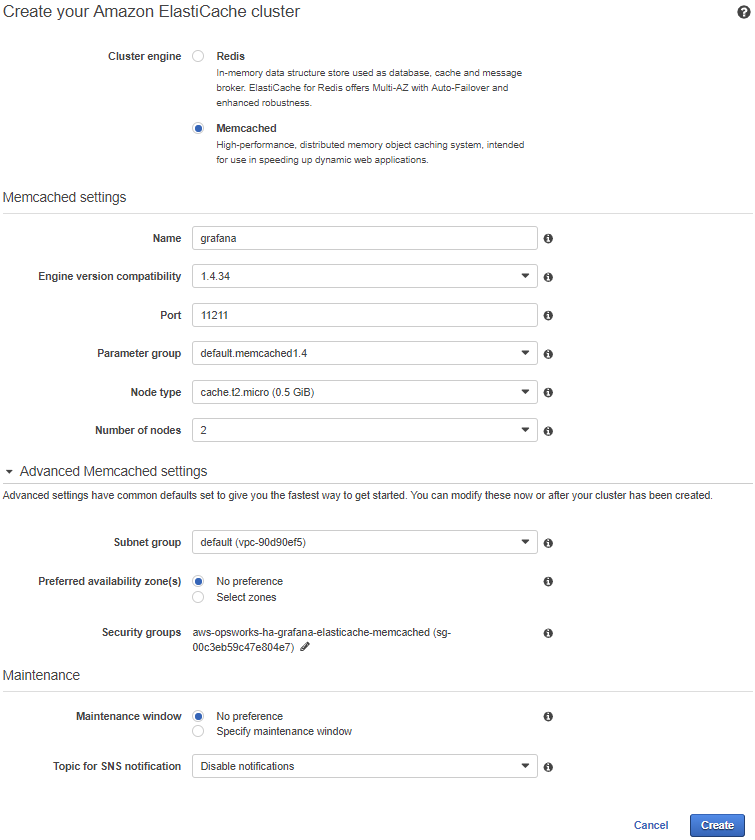
On the new page click in the top on the blue button called “Create” and you should come to a page titled “Create your Amazon ElastiCache cluster”.
Fill this page in with the following information:
Cluster Engine: Memcached
Name: grafana
Engine version compatibility: (leave as it is)
Port: (leave as it is)
Parameter group: (leave as it is)
Node type: Cache.t2.micro
Number of nodes: 2
Now open the “Advanced Memcached settings” and the only thing you change below here is the security groups part, we will change this to the one we created earlier.
Security groups: aws-opsworks-ha-grafana-elasticache-memcached
if you did everything as I wrote it should now look as follows: (click the image to enlarge it)
If it does then press the blue “Create” button it will take some time to create but then look like this:
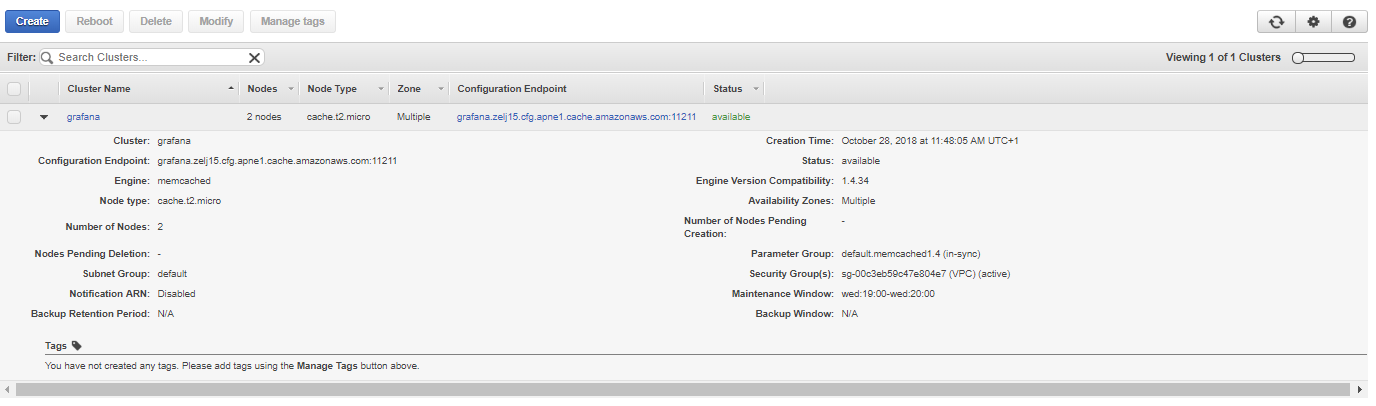
Make sure to write down the endpoint name as we need this later in the tutorial, for me it was:
Endpoint: grafana.zelj15.cfg.apne1.cache.amazonaws.com
Great job so far! you have created so far a key pair the security groups, a database instance, and the session caching server.
so all that is left is no create the OpsWorks environment and glue everything together.
Step 8: Create the OpsWorks grafana stack
We finally arrived at the OpsWorks part of this tutorial and we will start by creating the OpsWorks stack we require.
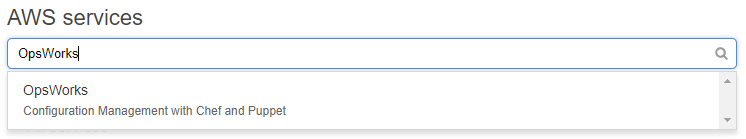
So once again click the AWS logo in the top of the page and this time search for “OpsWorks” and click on it.
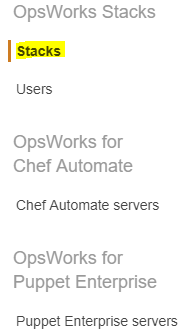
In the new windows if not already chosen by default click on “Stacks”:
Now click on the blue button called “Add your first stack” you should now see a window that looks like this:
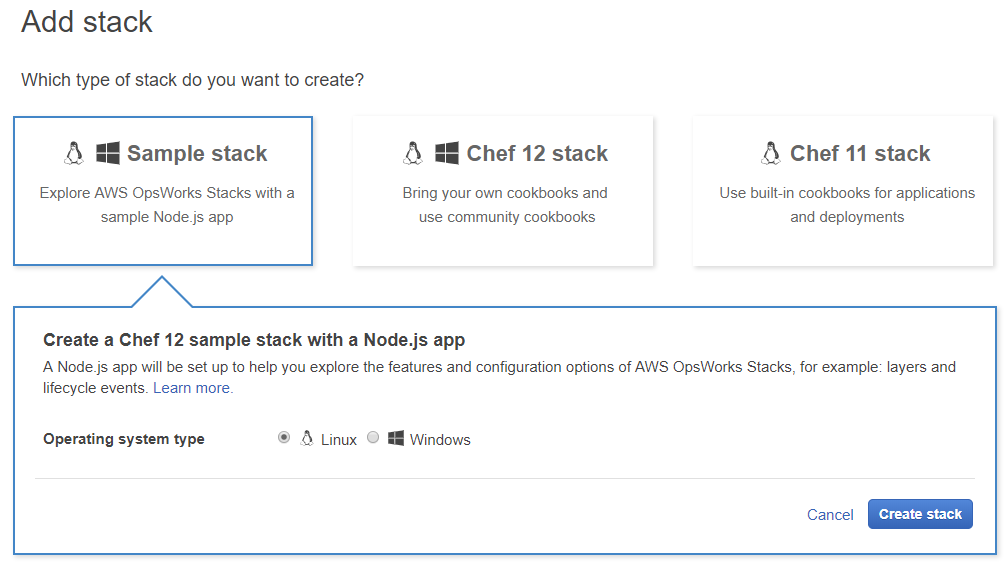
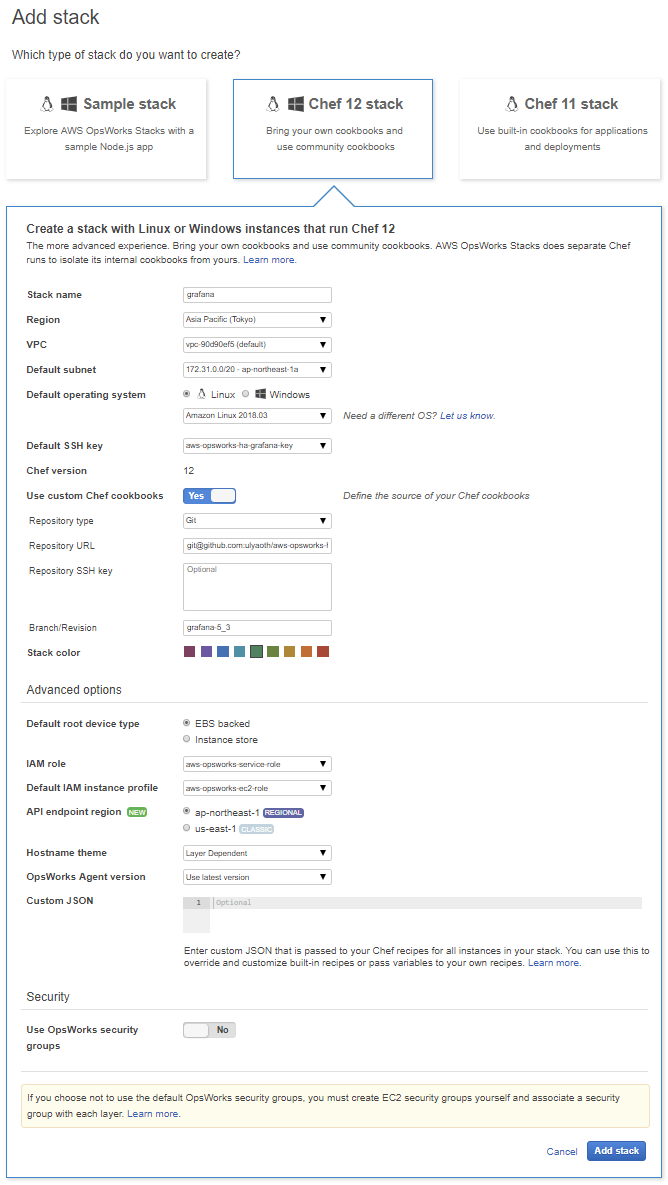
On this screen click on the button “Chef 12 stack” and fill everything in as follows:
Stack name: grafana
Region: Asia Pacific (Tokyo) – (Choose the region you want to use)
VPC: (leave as it is)
Default operating system: Linux (amazon Linux 2018.03) (choose the latest version always)
Default SSH key: aws-opsworks-ha-grafana-key
Chef version: 12
Use custom Chef cookbooks: Yes
Repository type: Git
Repository URL: git://github.com/ulyaoth/aws-opsworks-ha-grafana.gitt
Repository SSH key: (leave empty)
Branch/Revision: grafana-5_3
Stack color: (choose your favorite color)
Default root device type: EBS backed
IAM role: (leave as it is)
Default IAM instance profile: (leave as it is)
API endpoint region: (leave as it is)
Hostname theme: Layer dependent
OpsWorks Agent version: use latest version
Custom JSON: (leave empty)
Use OpsWorks Security groups: No
It should look like this:
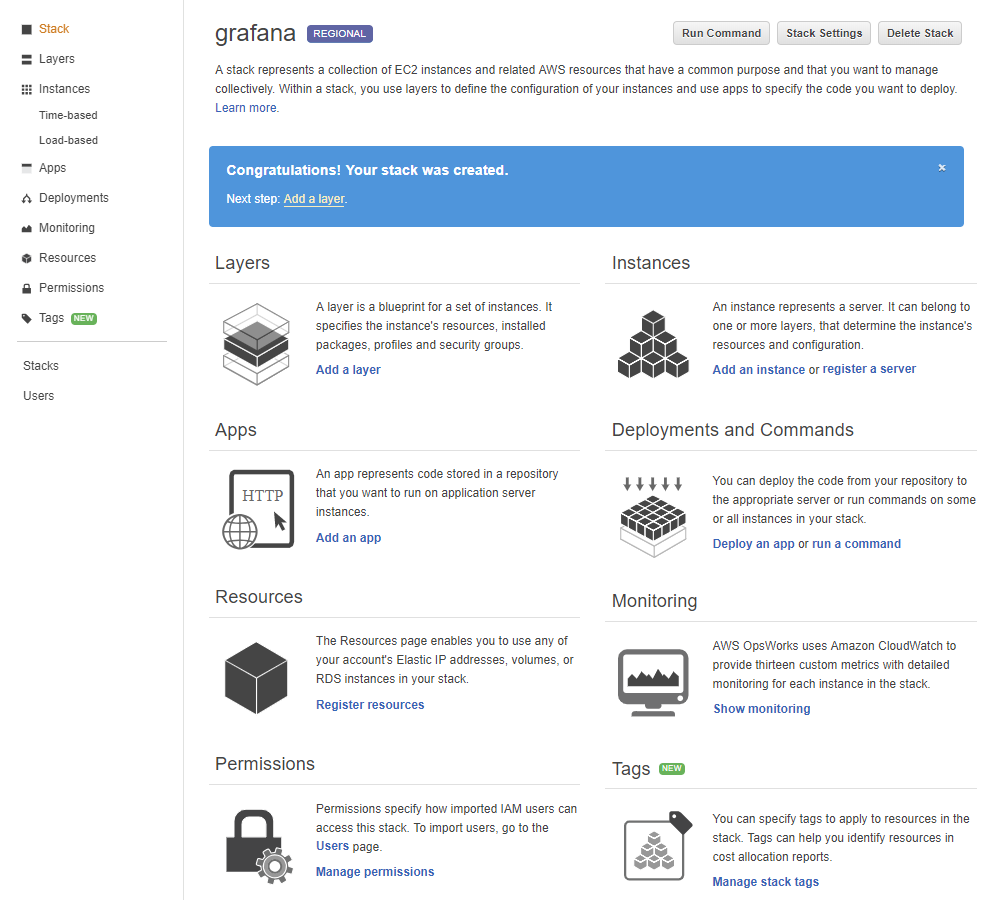
If it does then press on the blue button called “Add stack” and you will see a page like this:
 57
57
Step 9: Add your database to the OpsWorks stack layer
Now that we have created our Grafana stack we are going to add different layers to this, to start we will add our Aurora database to the Grafana stack.
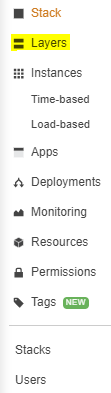
In the left menu click on the “Layers” button:
This will show you the following page:
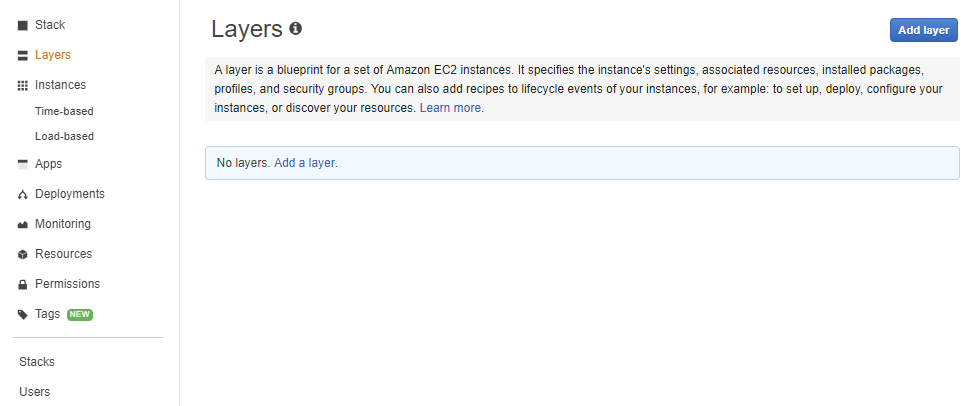
Now or click the blue button called “Add layer” or press the link “Add a layer” both will do the same and show you this:
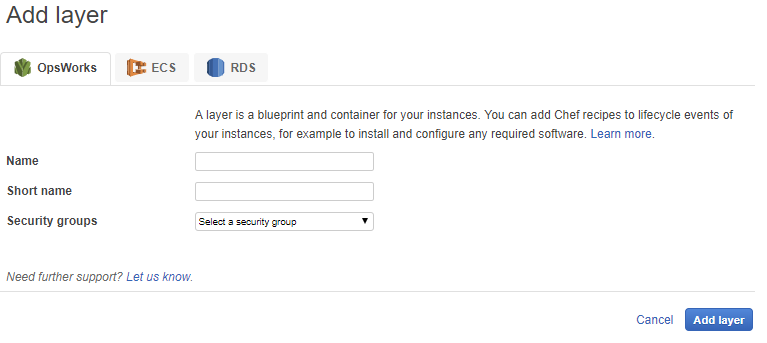
To add your RDS Aurora database to this layer you can do this by clicking on the RDS button.
You should now see the following:
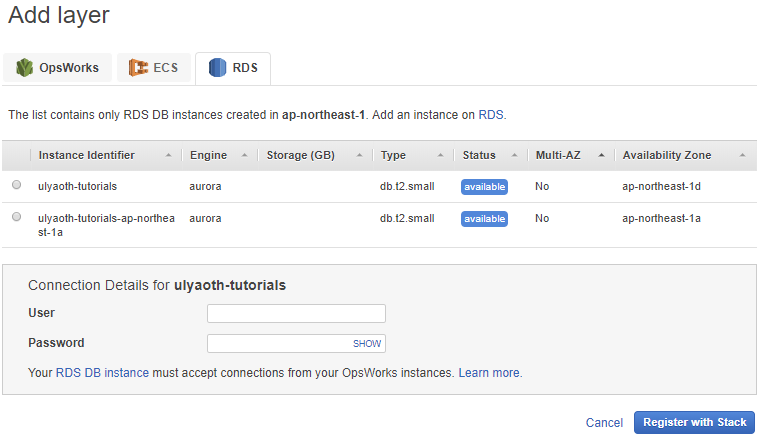
Click you want to use “ulyaoth-tutorials” and then you fill in the User and Password you used at Step XX.

And then press on “Register with Stack”.
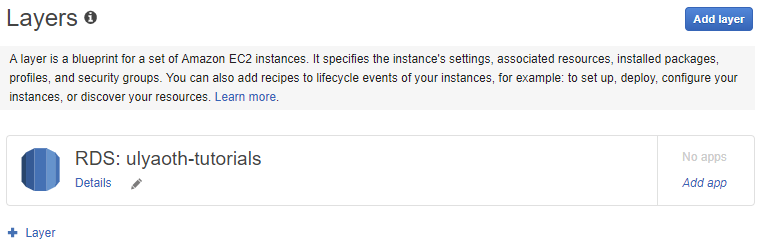
You will come back to the “Layers” page and you now you see you added your first layer to OpsWorks.
Step 10: Create the Grafana server layer.
Now that we added our database layer it is time to create the layer that will hold the Grafana servers.
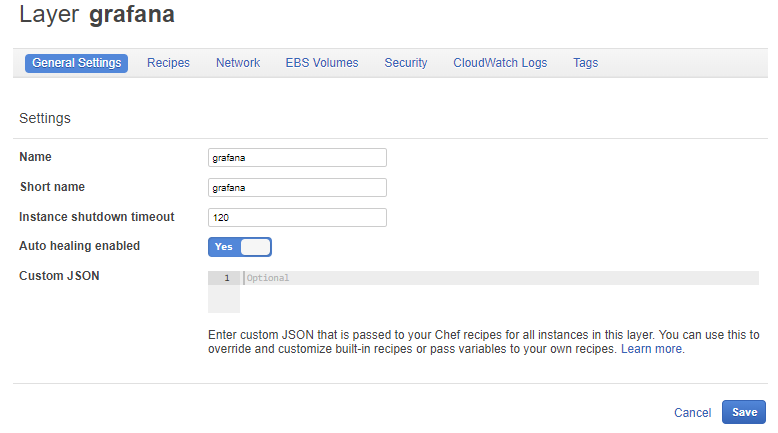
On the layer page press the “Add layer” button once more this time fill it in as below.
Name: grafana
Short name: grafana
Security groups: aws-opsworks-ha-grafana-opsworks-servers
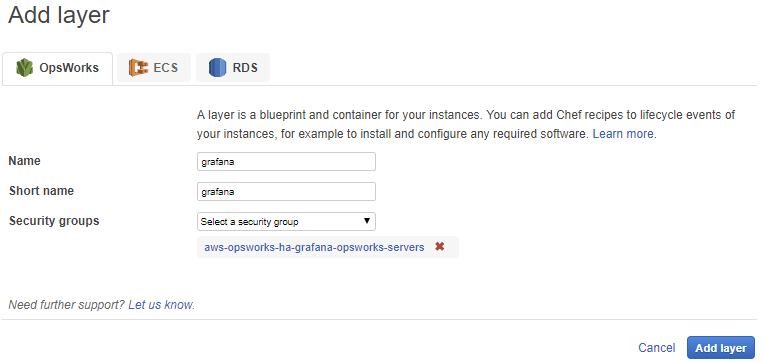
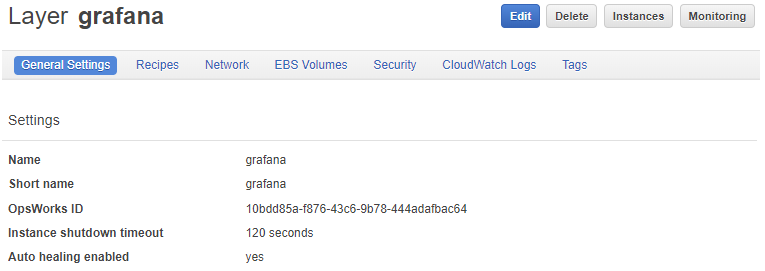
You once again should come back to the layer page and this time it should look as follows:
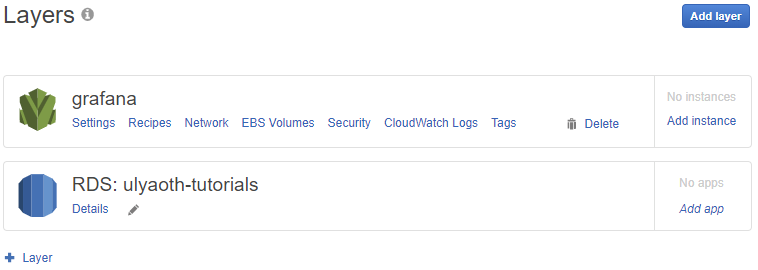
If it looks the same than congratulations you have created now all the layers in OpsWorks that are required, so all that is left now is to configure the Grafana layer so it has the right settings.
Step 11: Configure the Grafana server layer.
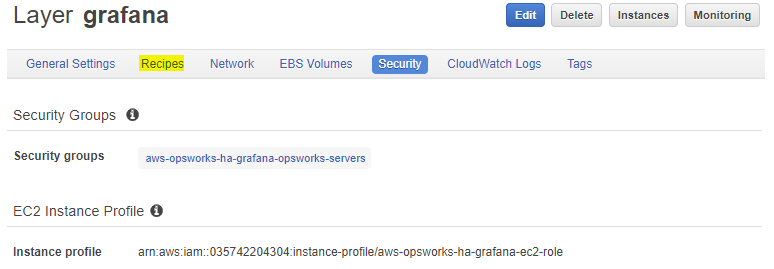
On the “grafana” layer click on “Security”:
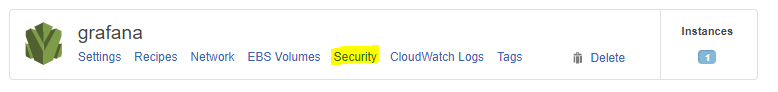
And you should now see a page that looks like this:
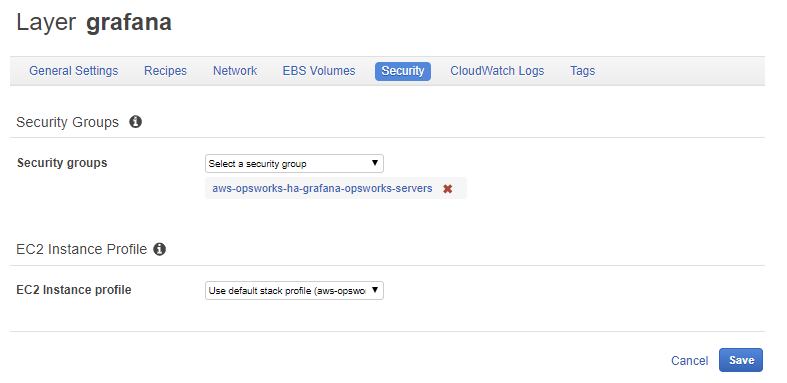
Now remember that we created a role and attached a policy to it, we have to select that role now on this page!
So change the EC2 Instance Profile to the following:
EC2 Instance Profile: aws-opsworks-ha-grafana-ec2-role
It should look like this now the page:
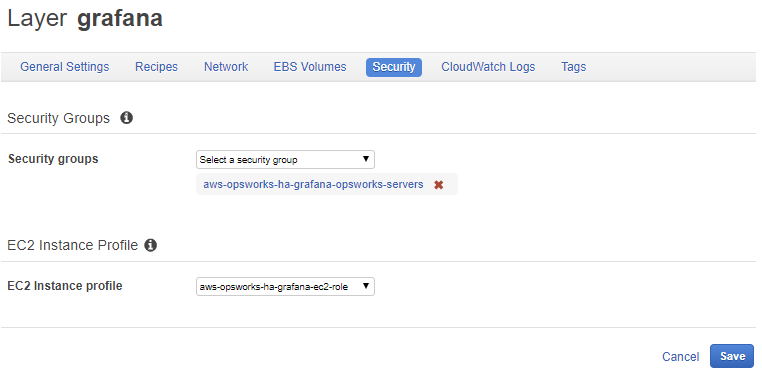
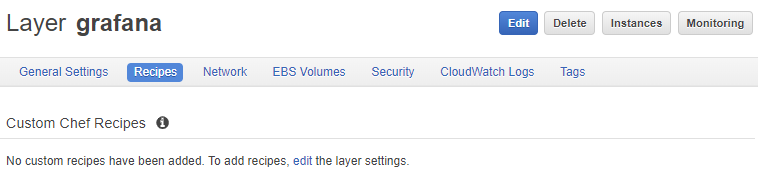
if it does then press on the blue “Save” button and you should see the following:
Press on the “Recipes” link that I marked yellow in the above picture and you will see:
Now on the top press on the “Edit” button and fill it in as following, you copy it to the box and then press the blue + button:
Setup: ulyaoth_grafana::grafana-setup alb_support::attach_to_alb
Shutdown: alb_support::detach_from_alb

And then you can press the blue “Save” button, it should all look as following then:
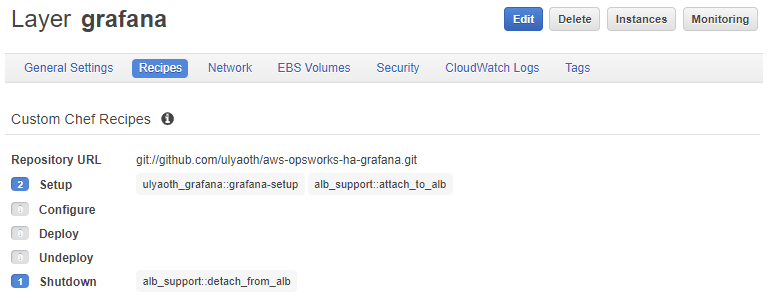
So just to explain what you did, OpsWorks uses chef recipes that will install the server, when the server starts it will run “Setup” when the server stops it will run “Shutdown”.
Recipes:
alb_support::attach_to_alb
alb_support::detach_from_alb
The above two recipes are provided by AWS and they will simply add and remove your server to and from the load balancer we created.
ulyaoth_grafana::grafana-setup
This recipes I created it is extremely simple and probably not very professional 🙂 but it works for the purpose of this tutorial, all it does is install Grafana and configure it.
You can see what it contains here:
Press on the “Edit” button and it will show an additional field called “Custom JSON”:
You will need to copy paste the following piece of JSON code in that field, but not before we will change it.
{

"alb_helper":

{

"target_group_arn": "LOADBALANCER TARGET GROUP ARN"

},

"ulyaoth_tutorial":

{

"mysql_host": "MYSQL HOST",

"mysql_user": "MYSQL USER",

"mysql_password": "MYSQL PASSWORD",

"memcache_host": "MEMCACHE HOST",

"grafana_domain": "YOUR DOMAIN"

}

}
Remember at every step I told you to collect things and you should have written it down, so you change the JSON file so it looks similar as this:
{

"alb_helper":

{

"target_group_arn": "arn:aws:elasticloadbalancing:ap-northeast-1:035742204304:targetgroup/grafana/8dd334f0fc6c808f"

},

"ulyaoth_tutorial":

{

"mysql_host": "ulyaoth-tutorials.cmjvdb4zv5m3.ap-northeast-1.rds.amazonaws.com",

"mysql_user": "ulyaoth",

"mysql_password": "FmKj!gW^a^2h$xbcdCY$7sGPo8U5Sp7SIXkYLnH",

"memcache_host": "grafana.zelj15.cfg.apne1.cache.amazonaws.com",

"grafana_domain": "grafana-tutorial.ulyaoth.com"

}

}
Of course you should use your information the above would not work for you, so really make sure you change it I am aware of putting your database password here is not the most secure solution but for this tutorial, it should be fine, see my comments at the end of this tutorial
about production usage.
You should by now have copied it in the “Custom JSON” field like this:
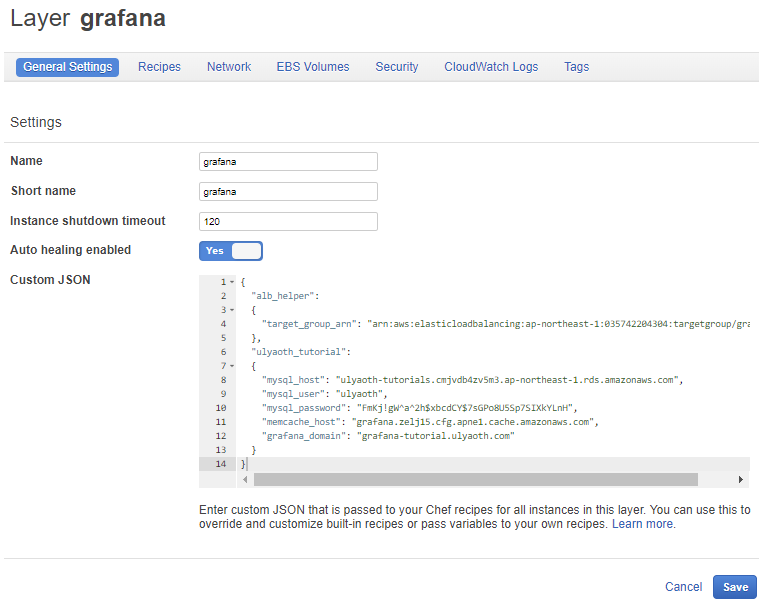
If you did then press the blue “Save” button and you see this:
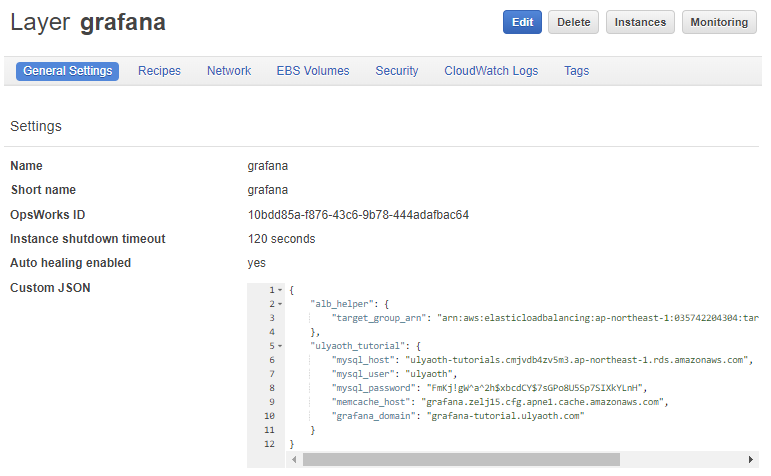
Congratulations you have done every single step to configure your environment! all that is left is start some servers and test it out.
Step 12: Create the instances in the Grafana layer.
All that is left is to create 3 servers that we can start that will run Grafana!
In the left menu click on the “Instances” link:
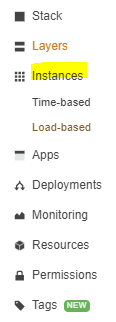
You will now see a page like this:
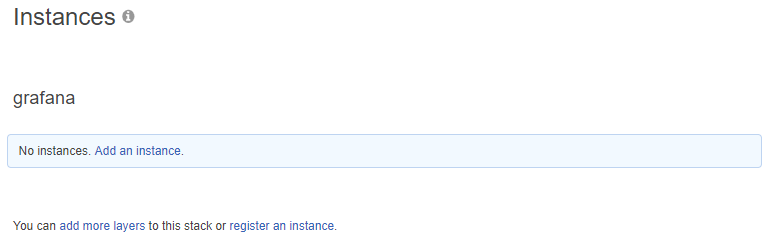
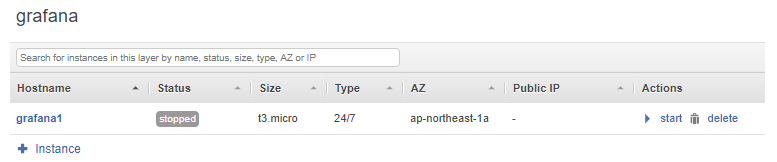
Press on the “Add an instance” link and fill it in as following:
Hostname: (do not change)
Size: t3.micro
Subnet: (choose subnet 1a)
and press “Add instance” and you see:
Press the “+Instance” link and repeat the step:
Hostname: (do not change)
Size: t3.micro
Subnet: (choose different subnet 1b for example)
After you created it then repeat and create one more server:
Hostname: (do not change)
Size: t3.micro
Subnet: (choose different subnet 1c for example)
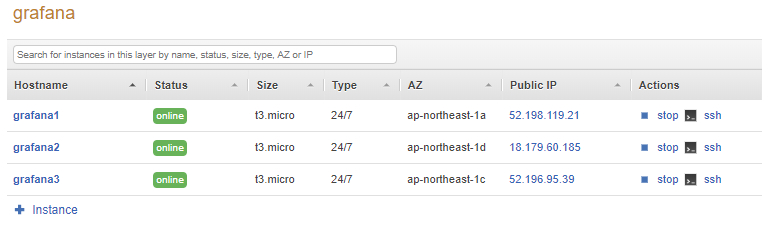
If you did it correct you should now see something similar as me:
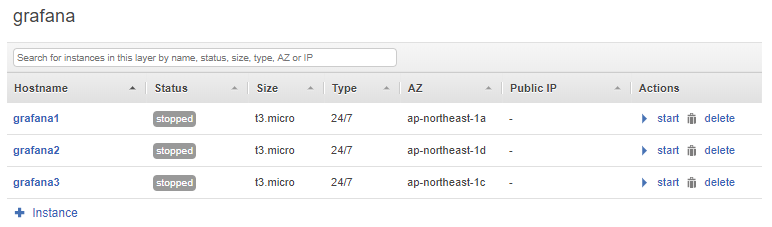
As you can see I did put every server in a different subnet (Availability Zone) for high availability, so if one goes down you are still loadbalanced to the other servers.
Step 13: Start your servers.
Wow we are at the end! let’s start the servers by pressing the big blue button in the top “Start All Instances”:
![]()
And you should see the status changes that it is starting to boot your servers:
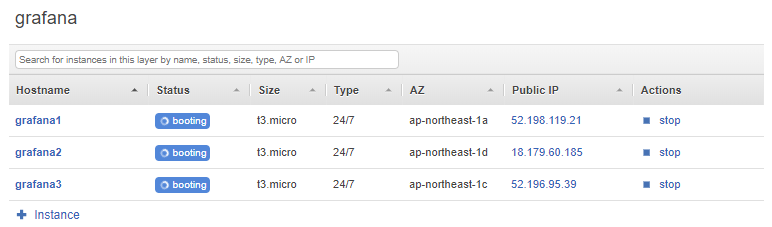
Just wait this can take a few minutes as it will install the server, but eventually you will see three servers that are showing a green status:
Congratulations! you just finished this too long tutorial :).
Now you can browse to the domain you choose for the loadbalancer, in my case it was:
https://grafana-tutorial.ulyaoth.com
And if you did everything correct you now see the following if you browse to your chosen domain:
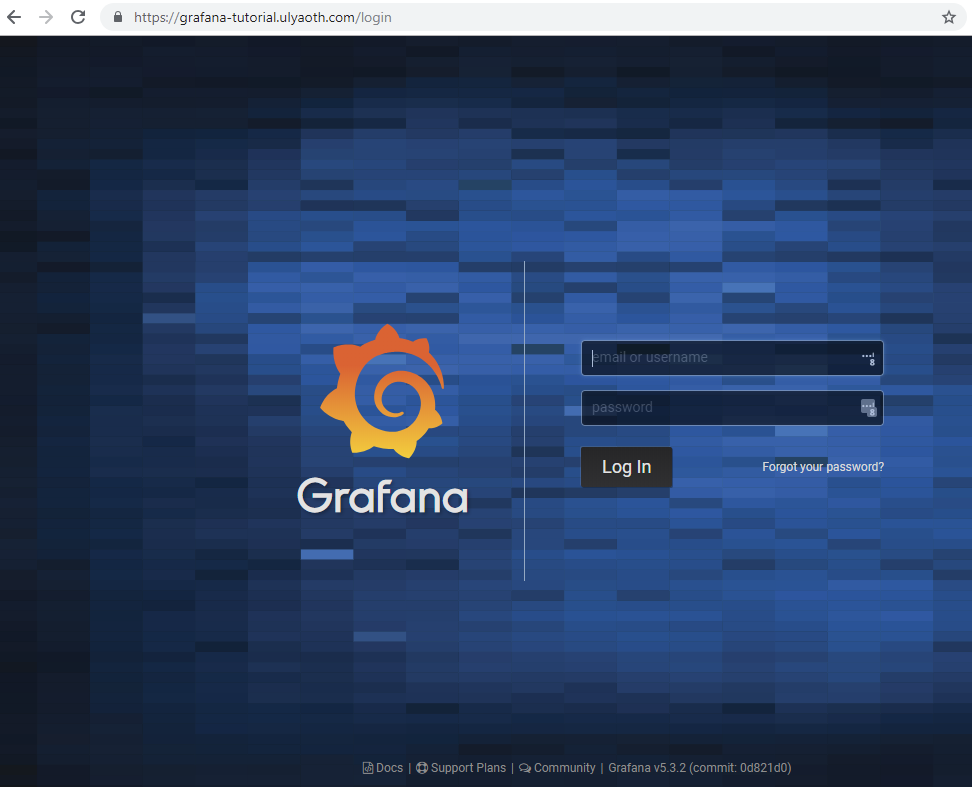
You can log in with the default user and password “admin/admin”.
The main purpose of this tutorial was to show OpsWorks as it is a great tool for DevOps! I hope you learned something and as always feel free to post on my forum if you did see things that could have done better as I love to learn myself also!
Additional notes for production:
I wrote this guide in a way that would be the easiest to just show OpsWorks and its capabilities, there are some things you would need
to really do differently if you would want to do something like this in production.
1. Never use the Aurora “Master” user/password instead you first log in to your database and create a Grafana user and password.
2. My chef recipe is very poorly written and it does a very basic job if you get serious please look at something like the chef cookbook for Grafana: https://supermarket.chef.io/cookbooks/grafana
3. You would want to put the actually Grafana servers in a private subnet, now you see I have public IP’s on each server you would want to avoid this since the load balancer will only access them.
4. Create the database on a different subnet from your grafana servers.
3. I think I do not have to tell you how insecure it is to add your password in a plain JSON file, I did so because it made it easier for this tutorial. The correct way would be to or read the password from the OpsWorks Database layer, or create an “App” in OpsWorks that would run the configuration of Grafana, this allows you to add “secret” variables that people cannot read.