
In this guide I will provide an example of how to set up a Logstash server with a Kibana interface that does get the logs from rsyslog. While there are multiple other ways to get logs into Logstash I will focus in this guide on rsyslog only.
For a dashboard Kibana 3 example please see:
Create a Logstash GeoIP dashboard in Kibana 3
I am aware that in the new Logstash rpm everything such as Kibana is merged into one package, But I feel personally it is better to install things separate as this gives you the possibility to update certain parts when you want without having to wait for a new rpms.
If you are going to use this in a production environment then please make sure to check the security implications of going the rsyslog way as you would need to open a port. So unless you are in an internal network everyone will be able to ship logs to your Logstash server.
So what is Logstash!?:
“Logstash is a tool for managing events and logs. You can use it to collect logs, parse them, and store them for later use (like, for searching). Speaking of searching, Logstash comes with a web interface for searching and drilling into all of your logs.“
There are a lot of examples on the official Logstash so I definitely recommend having a look there!
Their website: https://www.logstash.net
Now let’s start, for this guide I will be using the following programs:
Fedora 20
Logstash 1.4
rsyslog
ElasticSearch 1.3
Nginx
Kibana 3
Step 1: Install Logstash$ sudo yum install https://download.elasticsearch.org/logstash/logstash/packages/centos/logstash-1.4.2-1_2c0f5a1.noarch.rpm
Step 2: Install Nginx and some other programs$ sudo yum install nginx rsyslog tar wget policycoreutils-python zip
Step 3: Install elasticsearch
You will need to go to “https://www.elastic.co/downloads/elasticsearch” to make sure you have the latest version as they change their RPMs rapidly so it would be difficult to keep this up-to-date.
Once you are on the site right click the rpm link and choose copy link then go to your console and do:$ sudo yum install [URL]
Example would be:$ sudo yum install https://download.elasticsearch.org/elasticsearch/elasticsearch/elasticsearch-1.3.4.noarch.rpm
Step 4: Go to the Logstash config directory$ cd /etc/logstash/conf.d
Step 5: Download the following Logstash config file$ sudo wget https://raw.githubusercontent.com/sbagmeijer/ulyaoth/master/guides/logstash/rsyslog/logstash.conf
Step 6: Change the ownership of the Logstash config file$ sudo chown logstash:logstash logstash.conf
Step 7: Create the following directories:$ sudo mkdir -p /var/log/nginx/kibana $ sudo mkdir -p /usr/share/nginx/kibana/public $ sudo mkdir -p /etc/nginx/sites-available $ sudo mkdir -p /etc/nginx/sites-enabled
Step 8: Delete the current nginx.conf$ sudo rm -rf /etc/nginx/nginx.conf
Step 9: Go to the nginx directory$ cd /etc/nginx/
Step 10: wget a new nginx.conf$ sudo wget https://raw.githubusercontent.com/sbagmeijer/ulyaoth/master/guides/logstash/nginx/conf/nginx.conf
Step 11: Open the new nginx.conf$ sudo vi /etc/nginx/nginx.conf
Step 12: Change the following line to fit your cpu amountworker_processes 1;
Since I have two virtual CPUs I am using “2” I feel personally there is not much point going above 4. Just save the file after you added your changes.
Step 13: Go to the nginx vhost directory$ cd /etc/nginx/sites-available/
Step 14: wget the kibana vhost file$ sudo wget https://raw.githubusercontent.com/sbagmeijer/ulyaoth/master/guides/logstash/nginx/vhost/kibana.conf
Step 15: Open the kibana vhost file$ sudo vi /etc/nginx/sites-available/kibana.conf
Step 16: Change the site name
Simply change the “logstash.ulyaoth.net” to whatever your logstash url will be and save the file.
Step 17: Symbolic link the vhost file so nginx will load it$ sudo ln -s /etc/nginx/sites-available/kibana.conf /etc/nginx/sites-enabled/kibana.conf
Step 18: go to the kibana folder$ cd /usr/share/nginx/kibana/public
Step 19: Download the latest Kibana version$ sudo wget https://download.elasticsearch.org/kibana/kibana/kibana-latest.tar.gz
Or if you are like me you can get a newer version directly from their GitHub. (can be experimental)$ sudo wget https://github.com/elasticsearch/kibana/archive/master.zip
Step 20: Untar Kibana and fix directory stucture$ sudo tar xzfv kibana-latest.tar.gz $ sudo mv kibana-latest/* . $ sudo rm -rf kibana-latest.tar.gz $ sudo rm -rf kibana-latest
If you did download the “master.zip” file you will need to do the following instead:$ sudo unzip master.zip $ sudo mv kibana-master/src/* . $ sudo rm -rf master.zip $ sudo rm -rf kibana-master
Step 21: Open the config.js file$ sudo vi config.js
Step 22: Change the file slightly
Change the following line:default_route : '/dashboard/file/default.json'
To the following:default_route : '/dashboard/file/ulyaoth.json'
Step 23: Go to the dashboard directory$ cd /usr/share/nginx/kibana/public/app/dashboards
Step 24: Download my slightly altered dashboard file$ sudo wget https://raw.githubusercontent.com/sbagmeijer/ulyaoth/master/guides/logstash/kibana/dashboard/ulyaoth.json
Step 25: open ulyaoth.json$ sudo vi ulyaoth.json
Step 26: Change the site name
Change the following line:"title": "Ulyaoth: Logstash Search",
Change the bit “Ulyaoth: Logstash Search“,to whatever you would like to name your Kibana interface site and save the file.
Step 27: Create a nologin user called kibana$ sudo useradd -s /sbin/nologin kibana
Step 28: Chown the web dir to kibana:nginx$ sudo chown -R kibana:nginx /usr/share/nginx/kibana/
Step 29: Fix selinux and firewall$ sudo chcon -R -t httpd_sys_content_t /usr/share/nginx/kibana/public/ $ sudo semanage port -a -t http_port_t -p tcp 9200
Depending on your setup you probably would need to run something similar as I show below here.$ sudo firewall-cmd --zone=public --add-service=http $ sudo firewall-cmd --zone=public --add-port=9200/tcp
Step 30: Start Logstash, ElasticSearch and Nginx$ sudo systemctl start elasticsearch.service $ sudo systemctl start logstash.service $ sudo systemctl start nginx.service
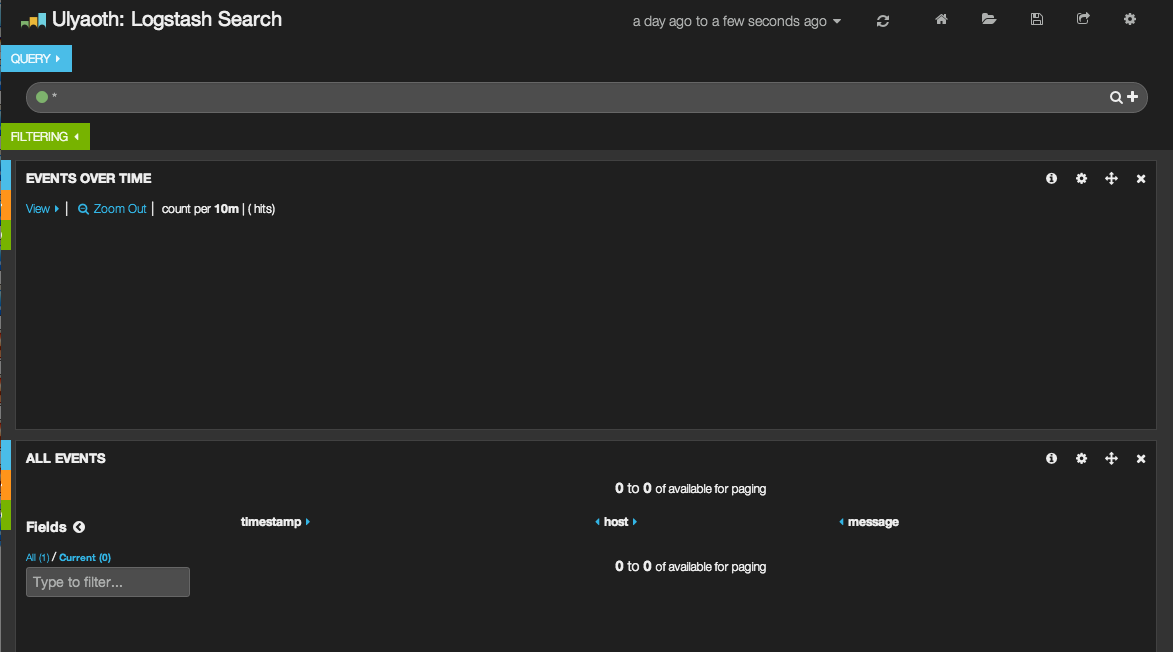
If you now go to your website for example for me “https://logstash.ulyaoth.net” you will see something like this:
Logstash is a product that is always in development so the screenshot above is outdated probably by now as they keep changing the interface, I would advise to keep my version of the interface as a grain of salt and experiment yourself with how you want to look.
You can do so by playing around with the dashboard files, everyone has his or her own taste so I decided to not make this part of my guide but just focus on how to install it.
Of course, there is no data so let us move forward and do the rsyslog configuration that will ship the specific logs to your Logstash server.
Step 31: Fix firewall
This step might not be required for everyone and you might want to tweak it to your needs.$ sudo firewall-cmd --zone=public --add-port=5544/tcp $ sudo firewall-cmd --zone=public --add-port=5544/udp
Step 32: Create the rsyslog logstash file$ sudo vi /etc/rsyslog.d/logstash.conf
Step 33: add the logs you want to ship (nginx example)$ModLoad imfile
$InputFileName /var/log/nginx/kibana/error.log $InputFileTag kibana-nginx-errorlog: $InputFileStateFile state-kibana-nginx-errorlog $InputRunFileMonitor
$InputFileName /var/log/nginx/kibana/access.log $InputFileTag kibana-nginx-accesslog: $InputFileStateFile state-kibana-nginx-accesslog $InputRunFileMonitor
$InputFilePollInterval 10
if $programname == ‘kibana-nginx-errorlog’ then @logstash.ulyaoth.net:5544 if $programname == ‘kibana-nginx-errorlog’ then ~ if $programname == ‘kibana-nginx-accesslog’ then @logstash.ulyaoth.net:5544 if $programname == ‘kibana-nginx-accesslog’ then ~
(Of course change it to fit you and your domain name)

Step 34: restart rsyslog$ sudo systemctl restart rsyslog.service
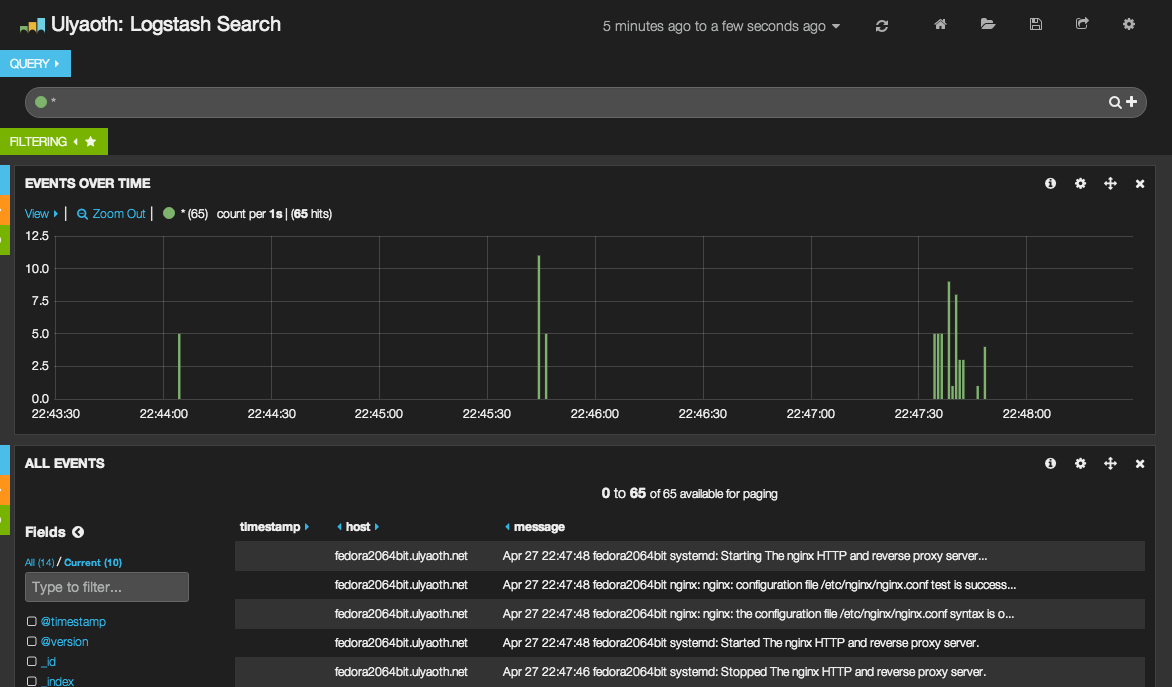
This is it everything should be working now 🙂 you should now be seeing something like this if you go to your Logstash website:
Some more information about the rsyslog config:
“$InputFileName” Here you specify the log you want to sent to logstash
“$InputFileTag” This is the name you will see in logstash
I think by seeing the Nginx example you will get the picture and can change it so it will work for any kind of logs you would like to ship to Logstash. Please remember to add the “if $programname” two times and the second time it has to end with “then ~”if you do not do this, you will spam your “/var/log/messages”.
There is another way to ship logs from the Logstash server itself you can alter the configuration file from “/etc/logstash/conf.d/logstash.conf” to directly read the log files. You will need to change the “input” to something like this:input { syslog { type => syslog port => 5544 codec => plain { charset => "ISO-8859-1" } }
file { type => syslog path => [ "/var/log/nginx/kibana/*.log", "/var/log/nginx/error.log" ] } }
Remember this part only works from the Logstash server itself. It is just a way to avoid using ryslog on the Logstash server itself.
problems that could occur
There is a bug in Logstash currently that it can only handle utf8 if your log is different then this it will crash Logstash a workaround is as you can see above to add the following:
codec => plain { charset => "ISO-8859-1" }
I hope this guide has helped you!