
Just adding some logstash-forwarder examples so I have them as a reminder for the future and perhaps it will help someone else also.
You can test your groks at this website:
https://grokdebug.herokuapp.com/
This is very useful to see if your grok does actually work correctly.
I will provide one full example for a Nginx “access.log” and then afterwards I provide simply the configs for additional programs that I find interesting.
Example: Nginx access.log
Step 1: Create the patterns directory$ sudo mkdir -p /opt/logstash/patterns
Step 2: Set the correct user and group on patterns directory$ sudo chown logstash:logstash /opt/logstash/patterns
Step 3: Create a log_format for nginx$ sudo vi /etc/nginx/nginx.conf
You add the following piece of code inside the “http” area this code below is default nginx so should be there already.
log_format main '$remote_addr - $remote_user [$time_local] "$request" ' '$status $body_bytes_sent "$http_referer" ' '"$http_user_agent" "$http_x_forwarded_for"';
Step 4: Add a filter inside your logstash config$ sudo vi /etc/logstash/logstash.conf
Then add the following filter:filter {
if [type] == "nginx-access" {
grok {
match => { "message" => "%{NGINXACCESS}" }
}
}
}
Step 5: Add the log file and field in logstash-forwarder config$ sudo vi /opt/logstash-forwarder/conf/logstash-forwarder.conf
Then inside your “files” bracket add the following:{
"paths": [
"/var/log/nginx/kibana/access.log"
],
"fields": { "type": "nginx-access" }
},
Step 6: Create the nginx pattern for logstash$ sudo vi /opt/logstash/patterns/nginx
And add the following:NGINXACCESS %{IPORHOST:remote_addr} - %{USERNAME:remote_user} \[%{HTTPDATE:time_local}\] "%{WORD:method} %{URIPATHPARAM:request} HTTP/%{NUMBER:httpversion}" %{INT:status} %{INT:body_bytes_sent} %{QS:http_referer} %{QS:http_user_agent}
Save the file and give the correct permissions to the file:$ sudo chown logstash:logstash /opt/logstash/patterns/nginx
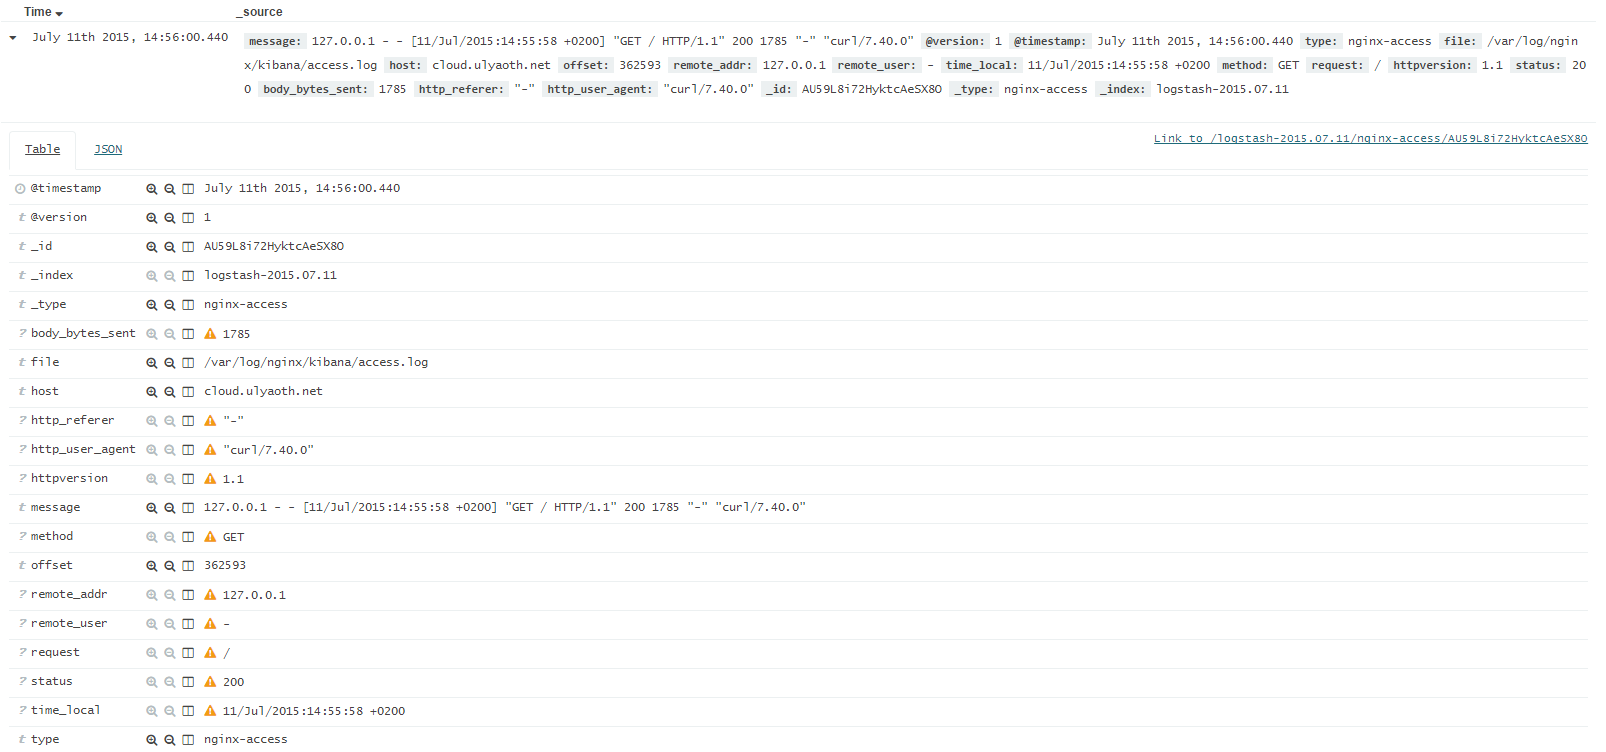
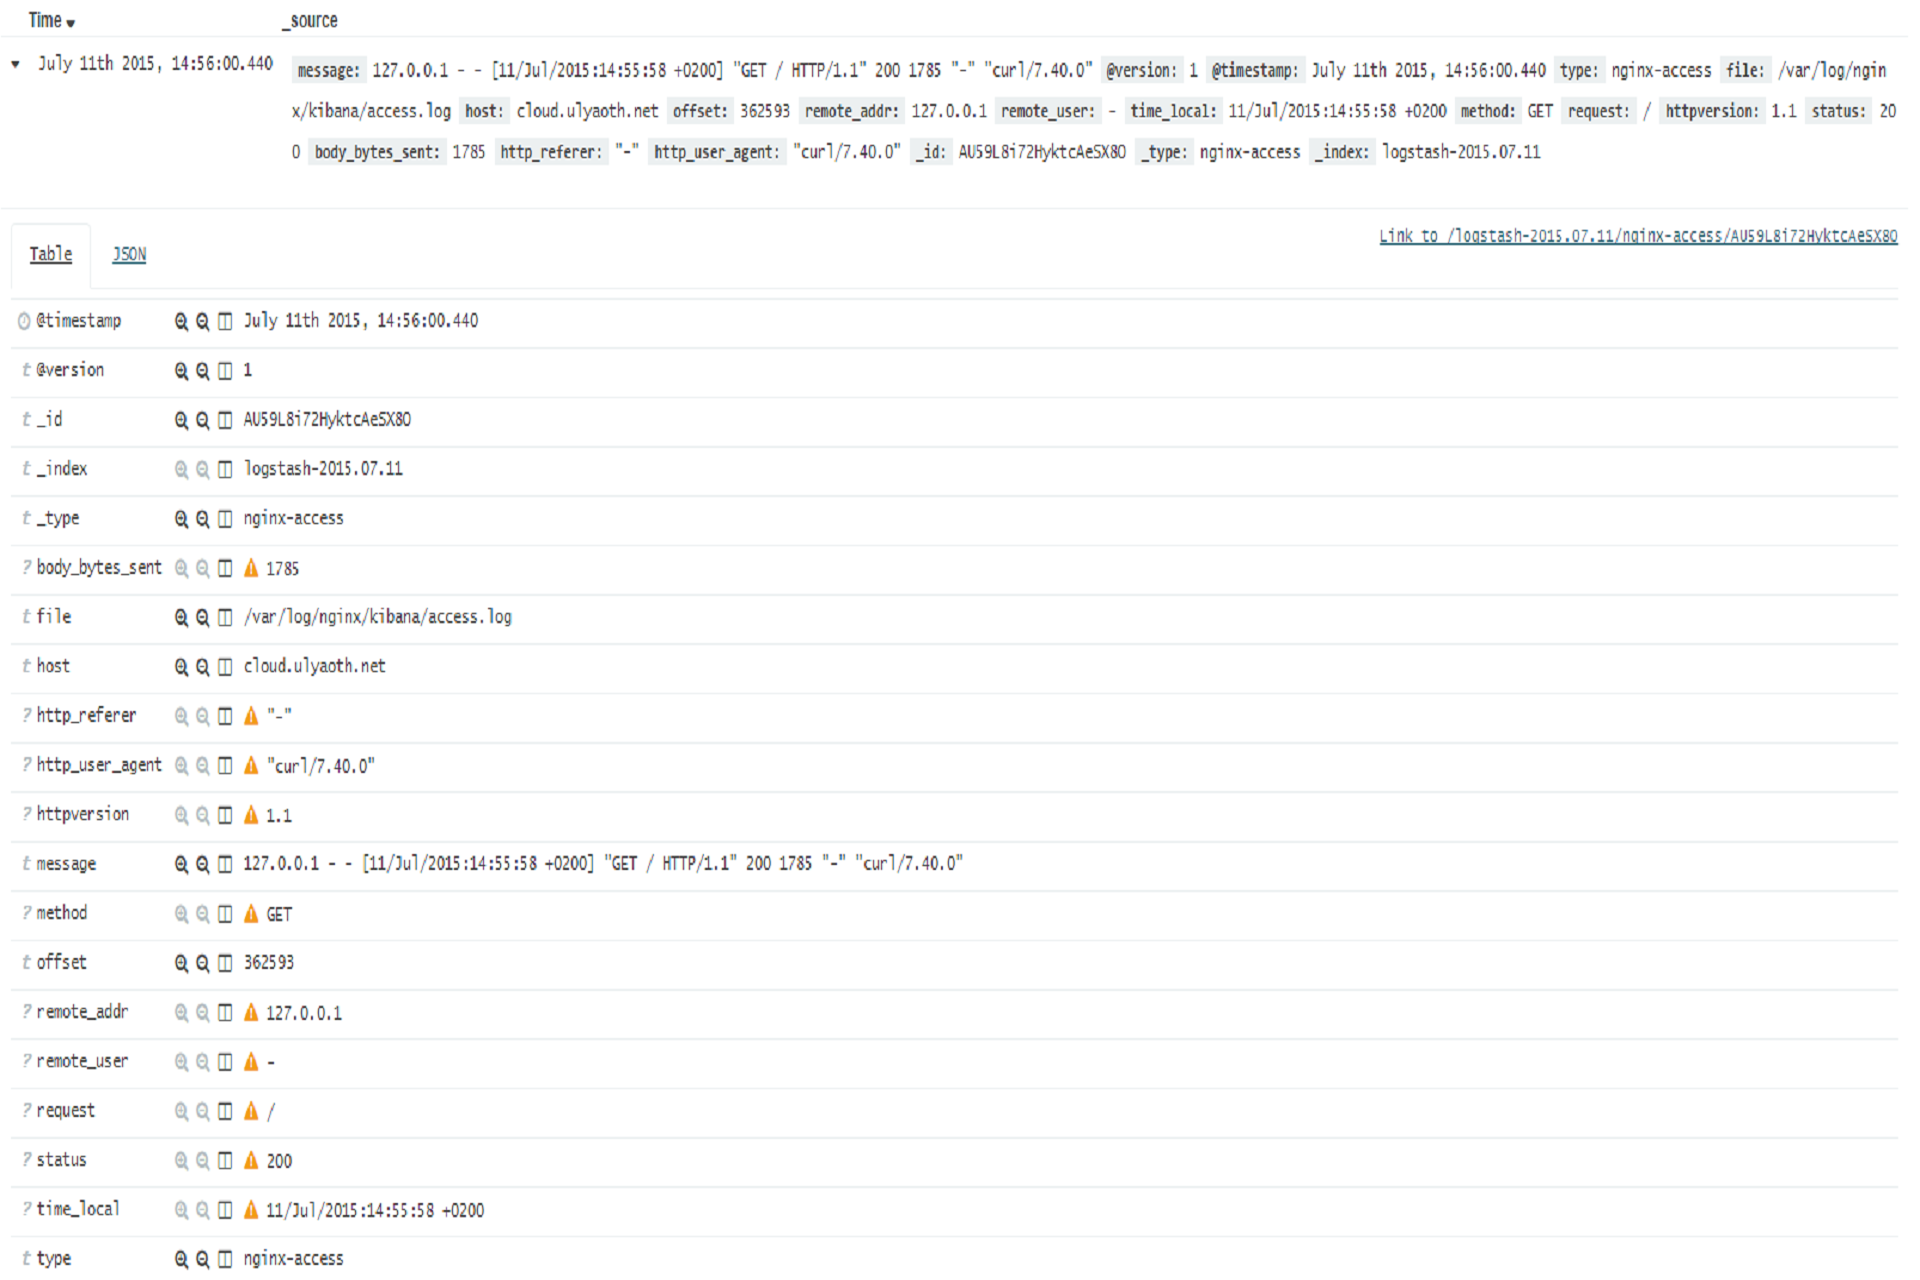
If you did it correctly then it should look like this:
As you can see the log file is now fully split up and you can use the different fields for better graphing.