
THIS TUTORIAL IS FOR KIBANA 3!
In this small example I will show you how to make a GeoIP based Dashboard for Logstash that for example can show by analyzing your access logs where your users come from.
This example was based on Nginx but nothing stops you from doing the exact same on Linux and Windows all you have to do is make a correct pattern for or Apache logs or for IIS logs and then change the configs above accordingly.
Also a more easy way is to make your Nginx log as json then you can avoid needing to make a pattern however since Nginx by default does not do so I will assume in this guide you not have Nginx logs in json format.
I will start by giving some steps to install it and then further down the post I will try go a little more into the details of the configuration file. (see below picture for this).
I assume you have done so then you can go ahead and follow the following steps.
Step 1: Download a new logstash configuration file and delete the old one
$ cd /etc/logstash/conf.d/
$ rm -rf logstash.conf
$ wget https://raw.githubusercontent.com/sbagmeijer/ulyaoth/master/guides/logstash/geoip/logstash.conf
Step 2: Download the Nginx pattern.
$ cd /opt/logstash/patterns/
$ wget https://raw.githubusercontent.com/sbagmeijer/ulyaoth/master/guides/logstash/patterns/nginx
Step 3: Download the dashboard to your pc. (not server)
https://raw.githubusercontent.com/sbagmeijer/ulyaoth/master/guides/logstash/dashboards/nginxaccesslocations
Now this is everything you need, you might want to change the name of the nginxaccesslog dashboard if you open the file just change the bit “Ulyaoth: Access Locations” to whatever you wish to call it.
Now simply go to your logstash website and press the “Load file” button (little folder icon) in the right top corner and then go with your mouse over “Advanced” and click on “Choose file” now simply select the Dashboard file you downloaded at “Step 3” called “nginxaccesslocations”.
I would suggest once loaded you press the save button (next to the folder icon” in the right top corner, once you do this you can next time directly choose this Dashboard from your “Load File” button without having to upload it.

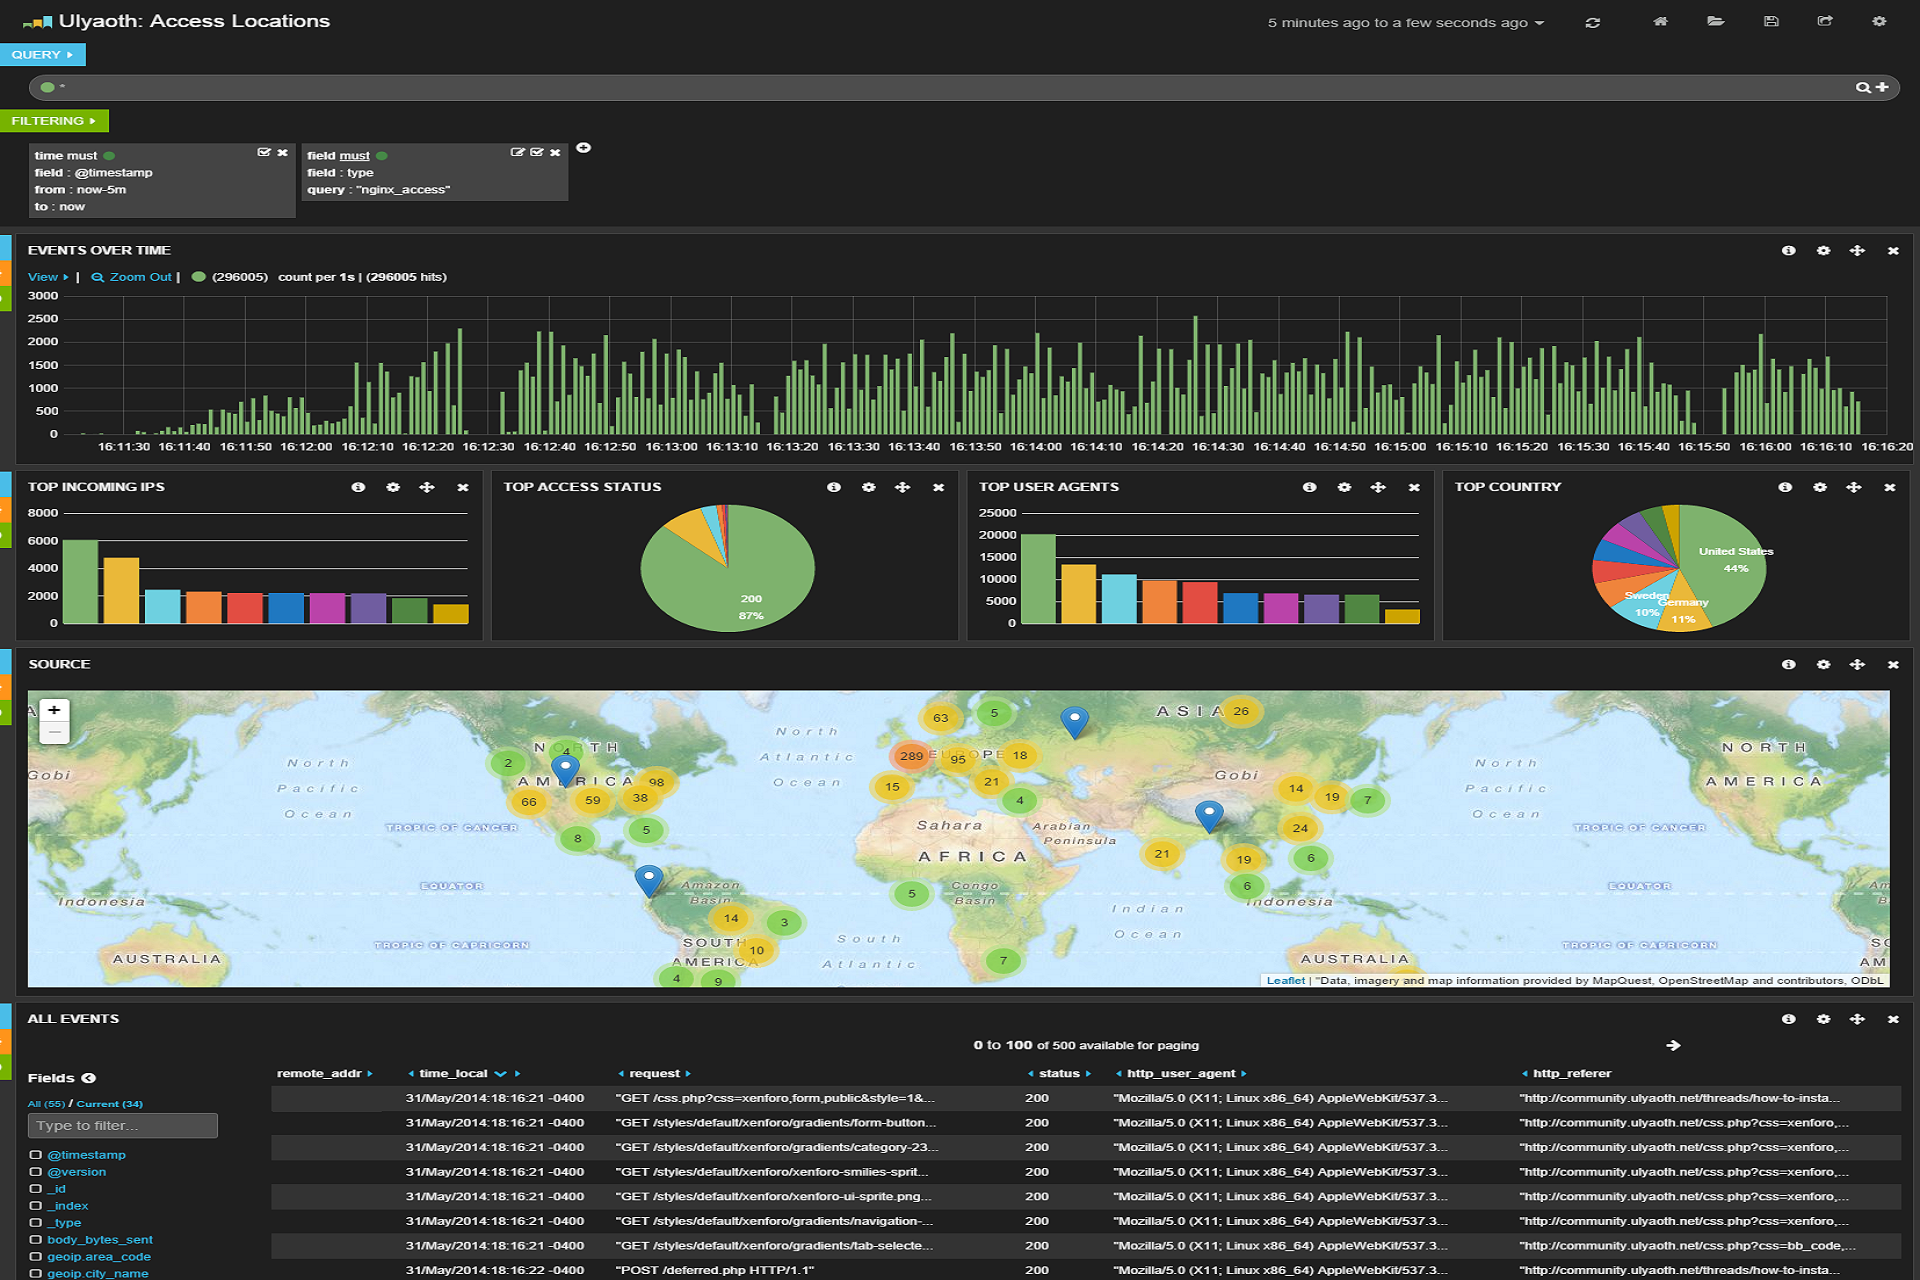
You should now see your dashboard based on your nginx access file as below:
Now lets explain the configuration files a little bit in more details, lets start with the smallest one that is the “nginx” pattern file.
nginx pattern file:
NGINXACCESSLOG %{IPORHOST:remote_addr} - %{USERNAME:remote_user} \[%{HTTPDATE:time_local}\] %{QS:request} %{INT:status} %{INT:body_bytes_sent} %{QS:http_referer} %{QS:http_user_agent}
All this file does is just splitting the Nginx access.log file in different variables that you then can use in Logstash, I think it is self explanatory if you have a look at a Nginx access.log example:
8.8.4.4 - - [24/May/2014:08:25:46 -0400] "GET /styles/default/xenforo/xenforo-smilies-sprite.png HTTP/1.1" 200 8205 "http://community.ulyaoth.net/threads/how-to-install-logstash-kibana-on-fedora-using-rsyslog-as-shipper.11/" "Mozilla/5.0 (Windows NT 6.3; WOW64) AppleWebKit/537.36 (KHTML, like Gecko) Chrome/35.0.1916.114 Safari/537.36"
some examples:
NGINXACCESSLOG = this is the name of the pattern that you use in logstash.conf.
%{IPORHOST:remote_addr} = this matches the 8.8.4.4
%{INT:status} = this matches the 200 okay we got in this entry
%{QS:request} = this matches the actual requested page or file so in this case “/styles/default/xenforo/xenforo-smilies-sprite.png”
Lets move to the logstash.conf file now, the whole file looks as following:
input {
file {
type => nginx_access
path => [ "/var/log/nginx/kibana/access.log" ]
start_position => "beginning"
}
}
filter {
mutate {
add_field => [ "hostip", "%{host}" ]
}
if [type] == "nginx_access" {
grok {
type => "nginx_access"
patterns_dir => "./patterns"
pattern => "%{NGINXACCESSLOG}"
}
geoip {
source => "remote_addr"
target => "geoip"
database =>"/opt/logstash/vendor/geoip/GeoLiteCity.dat"
add_field => [ "[geoip][coordinates]", "%{[geoip][longitude]}" ]
add_field => [ "[geoip][coordinates]", "%{[geoip][latitude]}" ]
}
mutate {
convert => [ "[geoip][coordinates]", "float" ]
}
}
}
output {
elasticsearch {
host => localhost
}
}
Now as you can see I have as input my nginx access.log, the important part here is that i called the type “nginx_access” because if you look further you see now the geoip part and pattern part lets split that bit up a little bit.
if [type] == "nginx_access" {
grok {
type => "nginx_access"
patterns_dir => "./patterns"
pattern => "%{NGINXACCESSLOG}"
}
In this bit above I am basically saying if Logstash catches anything that has the type “nginx_access” then it should apply a pattern to all of this and the pattern it should apply is the “NGINXACCESSLOG” you remember? this was the file I explained above.
geoip {
source => "remote_addr"
target => "geoip"
database =>"/opt/logstash/vendor/geoip/GeoLiteCity.dat"
add_field => [ "[geoip][coordinates]", "%{[geoip][longitude]}" ]
add_field => [ "[geoip][coordinates]", "%{[geoip][latitude]}" ]
}
mutate {
convert => [ "[geoip][coordinates]", "float" ]
}
This bit above is the code required to make GeoIP work important here is the “source” input, the input “remote_addr” is the ip addresses that it will check, if you call your field of remote ip addresses different you have to specify this here.
Also if you have the GeoIP database file on a different location for example if you have the paid version (logstash includes the free version) then specify this at the “database” bit.
I hope this helped you since this is also for me the first time I start looking into this there might be errors and mistakes I did make.